Home About Chat Users Issues Party Candidates Polling Firms Media News Polls Calendar Key Races United States President Senate House Governors International

New User Account
"A comprehensive, collaborative elections resource." 
Email: Password:

  PA - District 14 - History
House of Representatives DETAILS
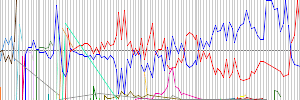
Parents > United States > Pennsylvania > PA - District 14   Raw Vote Total:

Percentages:

Website
Established March 04, 1813
Disbanded Still Active
Last ModifiedRP April 29, 2011 07:00pm
Description

RACES [Show Primaries]
Redistricting: Light Green=Added Territory, Red=Removed Territory,
Dark Green=Kept Territory
Date Type Results
Nov 05, 2024 General Election
 Guy Reschenthaler(I)
268,380
66.57%
 Chris Dziados
134,755
33.43%
Nov 08, 2022 General Election
 Guy Reschenthaler(I)
230,865
100.00%
Date Type Results
Nov 03, 2020 General Election
 Guy Reschenthaler(I)
241,688
64.69%
 Bill Marx
131,895
35.31%
Nov 06, 2018 General Election
 Guy Reschenthaler
151,386
57.91%
 Bibiana Boerio
110,051
42.09%
Date Type Results
Nov 08, 2016 General Election
 Michael F. "Mike" Doyle(I)
255,293
74.37%
 Lenny McAllister
87,999
25.63%
Nov 04, 2014 General Election
 Michael F. "Mike" Doyle(I)
148,351
100.00%
Nov 06, 2012 General Election
 Michael F. "Mike" Doyle(I)
251,932
76.89%
 Hans Lessmann
75,702
23.11%
Date Type Results
Nov 02, 2010 General Election
 Michael F. "Mike" Doyle(I)
122,073
68.79%
 Melissa Ann Haluszczak
49,997
28.17%
 Ed B. Bortz
5,400
3.04%
Nov 04, 2008 General Election
 Michael F. "Mike" Doyle(I)
242,326
91.26%
 Christopher Titus North
23,214
8.74%
Nov 07, 2006 General Election
 Michael F. "Mike" Doyle(I)
161,075
90.09%
 Christopher Titus North
17,720
9.91%
Nov 02, 2004 General Election
 Michael F. "Mike" Doyle(I)
220,139
100.00%
Date Type Results
Nov 05, 2002 General Election
 Michael F. "Mike" Doyle(I)
123,323
100.00%
Date Type Results
Nov 07, 2000 General Election
 William J. Coyne(I)
147,533
99.85%
  Others (W)
216
0.15%
Nov 03, 1998 General Election
 William J. Coyne(I)
83,355
60.52%
 Bill Ravotti
52,745
38.29%
 Dorothy L. Kolis
1,625
1.18%
  Others (W)
11
0.01%
Nov 05, 1996 General Election
 William J. Coyne(I)
122,922
60.68%
 Bill Ravotti
78,921
38.96%
 Paul Scherrer
713
0.35%
  Others (W)
22
0.01%
Nov 08, 1994 General Election
 William J. Coyne(I)
105,310
64.13%
 John Robert Clark
53,221
32.41%
 Edward L. Stewart
3,826
2.33%
 Paul Scherrer
1,819
1.11%
  Others (W)
34
0.02%
Nov 03, 1992 General Election
 William J. Coyne(I)
165,633
72.32%
 Byron W. King
61,311
26.77%
 Joanne S. Kuniansky
1,300
0.57%
 Paul Scherrer
794
0.35%
Date Type Results
Nov 06, 1990 General Election
 William J. Coyne(I)
77,636
71.80%
 Richard Edward Caligiuri
30,497
28.20%
Nov 08, 1988 General Election
 William J. Coyne(I)
135,181
78.64%
 Richard Edward Caligiuri
36,719
21.36%
Nov 04, 1986 General Election
 William J. Coyne(I)
104,726
89.62%
 Richard Edward Caligiuri
6,058
5.18%
 Mark Weddleton
3,120
2.67%
 Thomas R. McIntyre
1,487
1.27%
 Phyllis Gray
1,468
1.26%
Nov 06, 1984 General Election
 William J. Coyne(I)
163,818
76.62%
 John Robert Clark
42,616
19.93%
 Richard Edward Caligiuri
6,699
3.13%
 Al Duncan
664
0.31%
Nov 02, 1982 General Election
 William J. Coyne(I)
120,980
74.87%
 John Robert Clark
32,780
20.29%
 Richard Edward Caligiuri
5,437
3.36%
 William Kalman
2,380
1.47%
Date Type Results
Nov 04, 1980 General Election
 William J. Coyne
102,545
68.54%
 Stan Thomas
44,071
29.45%
 Mary E. "Liz" Hughes
3,008
2.01%
Nov 07, 1978 General Election
 William S. Moorhead(I)
68,004
57.05%
 Stan Thomas
49,992
41.94%
 Stanley J. Kuziel
1,206
1.01%
Nov 02, 1976 General Election
 William S. Moorhead(I)
114,472
71.70%
 John F. Bradley
43,308
27.13%
 Carla M. Hoag
1,370
0.86%
 Scott Brody
494
0.31%
Nov 05, 1974 General Election
 William S. Moorhead(I)
93,169
77.43%
 Zachary T. Davis
27,116
22.53%
  Write-In (W)
47
0.04%
Nov 07, 1972 General Election
 William S. Moorhead(I)
106,158
59.34%
 Roland S. Catarinella
72,275
40.40%
 Ronald N. Henderson
460
0.26%
Date Type Results
Nov 03, 1970 General Election
 William S. Moorhead(I)
72,509
76.51%
 Barry Levine
21,572
22.76%
 Reuben F. Chaitin
687
0.72%
Nov 05, 1968 General Election
 William S. Moorhead(I)
96,117
69.44%
 Algia Gary
39,671
28.66%
 Harvey F. Johnston
2,620
1.89%
Nov 08, 1966 General Election
 William S. Moorhead(I)
83,967
68.27%
 Richard L. "Dick" Thornburgh
39,024
31.73%
Date Type Results
Nov 03, 1964 General Election
 William S. Moorhead(I)
117,525
74.84%
 Alvin D. Capozzi
39,513
25.16%
Nov 06, 1962 General Election
 William S. Moorhead(I)
93,130
65.65%
 Joseph M. Beatty
48,726
34.35%
Date Type Results
Nov 08, 1960 General Election
 George M. Rhodes(I)
60,211
53.78%
 James H. Mantis
51,746
46.22%
Nov 04, 1958 General Election
 George M. Rhodes(I)
51,281
58.28%
 Thomas C. Anthony
36,170
41.11%
 Darlington Hoopes
538
0.61%
Nov 06, 1956 General Election
 George M. Rhodes(I)
51,088
51.34%
 Thomas K. Leinbach
48,129
48.37%
 L. Birch Wilson
289
0.29%
Nov 02, 1954 General Election
 George M. Rhodes(I)
50,765
61.98%
 Donald F. Spang
31,136
38.02%
Nov 04, 1952 General Election
 George M. Rhodes(I)
48,427
49.66%
 James W. Bertolet
48,019
49.24%
 Darlington Hoopes
1,079
1.11%
Date Type Results
Nov 06, 1951 Special Election
 Joseph L. Carrigg
41,045
64.34%
 Paul Harris
22,752
35.66%
Nov 07, 1950 General Election
 Wilson D. Gillette(I)
45,986
60.89%
 John E. Snedecker
29,538
39.11%
Nov 02, 1948 General Election
 Wilson D. Gillette(I)
47,715
65.19%
 David Burchell
25,484
34.81%
Nov 05, 1946 General Election
 Wilson D. Gillette(I)
43,142
67.43%
 James S. Fields
20,842
32.57%
Nov 07, 1944 General Election
 Wilson D. Gillette(I)
51,333
64.99%
 Clement J. Reap
27,653
35.01%
Date Type Results
Nov 03, 1942 General Election
 Daniel K. Hoch
23,247
51.06%
 John C. Griesemer
19,498
42.83%
 Raymond S. Hofses
2,783
6.11%
Date Type Results
Nov 05, 1940 General Election
 Guy Louis Moser(I)
48,140
56.02%
 Joseph C. Evans
31,839
37.05%
 Raymond S. Hofses
4,980
5.79%
 Harry A. Obold
699
0.81%
 William M. Stottlmeyer
183
0.21%
 Ben Rubin
98
0.11%
Nov 08, 1938 General Election
 Guy Louis Moser(I)
34,678
46.74%
 John C. Evans
31,068
41.88%
 Raymond S. Hofses
8,446
11.38%
Nov 03, 1936 General Election
 Guy Louis Moser
46,192
53.26%
 Charles E. Roth
28,001
32.29%
 Raymond S. Hofses
11,278
13.00%
 Howard Moser
659
0.76%
 Charles Althouse
593
0.68%
Nov 06, 1934 General Election
 William E. Richardson(I)
39,134
63.35%
 Raymond S. Hofses
19,871
32.17%
 Robert S. McDonough
2,770
4.48%
Nov 08, 1932 General Election
 William E. Richardson
29,386
40.99%
 Thomas L. Rhodes
22,898
31.94%
 Raymond S. Hofses
19,319
26.95%
 George W. Brownback
93
0.13%
Date Type Results
Nov 04, 1930 General Election
 Norton L. Lichtenwalner
44,546
52.40%
 Robert G. Bushong
29,164
34.30%
 Andrew P. Bower
11,309
13.30%
Nov 06, 1928 General Election
 Charles J. Esterly
76,670
61.93%
 Abraham H. Rothermel
36,176
29.22%
 Howard McDonough
10,950
8.85%
Nov 02, 1926 General Election
 Robert G. Bushong
30,240
50.21%
 Arthur G. Dewalt
26,930
44.71%
 Raymond S. Hofses
3,050
5.06%
 Unidentified Scattering (W)
9
0.01%
Nov 04, 1924 General Election
 Charles J. Esterly
43,335
50.51%
 William M. Croll(I)
36,582
42.64%
 Raymond S. Hofses
5,884
6.86%
Nov 07, 1922 General Election
 William M. Croll
31,592
48.23%
 Fred B. Gernerd(I)
29,617
45.21%
 George W. Snyder
4,294
6.56%
Date Type Results
Nov 02, 1920 General Election
 Louis T. McFadden(I)
27,782
76.04%
 Thomas A. Doherty
8,248
22.57%
 E.R.W. Searle
503
1.38%
 Unidentified Scattering (W)
3
0.01%
Nov 05, 1918 General Election
 Louis T. McFadden(I)
11,267
66.03%
 Albert M. Cornell
4,873
28.56%
 Edwin P. Young
807
4.73%
 William Shallenberger
117
0.69%
Nov 07, 1916 General Election
 Louis T. McFadden(I)
13,638
55.60%
 John D. Brennan
8,881
36.20%
 William S. Heermans
1,279
5.21%
 Frank E. Wood
430
1.75%
 Worthy Arthur
302
1.23%
Nov 03, 1914 General Election
 Louis T. McFadden
9,153
40.30%
 Fred W. Dean
6,219
27.38%
 Dana R. Stephens
6,196
27.28%
 Gates S. Comstock
899
3.96%
 George Schrimp
243
1.07%
Nov 05, 1912 General Election
 William D.B. Ainey(I)
14,747
61.07%
 Joel G. Hill
8,384
34.72%
 William S. Heermans
706
2.92%
 Charles Welch
312
1.29%
Nov 07, 1911 Special Election
 William D.B. Ainey
13,860
55.61%
 Oscar H. Rockwell
11,062
44.39%
Nov 08, 1910 General Election
 George W. Kipp
10,276
48.99%
 Charles C. Pratt(I)
9,481
45.20%
 James A. Hodgins
974
4.64%
 Sidney R. Matteson
244
1.16%
Date Type Results
Nov 03, 1908 General Election
 Charles C. Pratt
15,024
51.24%
 George W. Kipp(I)
12,980
44.27%
 E.H. Meeker
1,127
3.84%
 William Markham
189
0.64%
Nov 06, 1906 General Election
 George W. Kipp
12,091
49.22%
 Mial E. Lilley(I)
11,288
45.96%
 G.P. Little
1,184
4.82%
Nov 08, 1904 General Election
 Mial E. Lilley
15,568
58.40%
 John Kuhbach
8,696
32.62%
 William S. Heermans
2,393
8.98%
Nov 04, 1902 General Election
 Charles F. Wright(I)
14,401
54.89%
 James West
10,727
40.89%
 Francis H. Dickerson
1,109
4.23%
Date Type Results
Nov 06, 1900 General Election
 Marlin Edgar Olmsted(I)
23,731
89.49%
 Edwin H. Molly
1,451
5.47%
 Benjamin Forster
1,335
5.03%
Nov 08, 1898 General Election
 Marlin Edgar Olmsted(I)
19,352
60.78%
 Wilson W. Gray
9,926
31.17%
 Lee L. Crumbine
2,564
8.05%
Nov 03, 1896 General Election
 Marlin Edgar Olmsted
25,014
87.69%
 Jacob F. Klugh
1,948
6.83%
 Abraham Mattis
1,101
3.86%
 Benjamin H. Engle
462
1.62%
Nov 06, 1894 General Election
 Ephraim M. Woomer(I)
19,139
64.13%
 William H. Minick
9,177
30.75%
 Adam R. Forney
1,176
3.94%
 Adam Behney
354
1.19%
Nov 08, 1892 General Election
 Ephraim M. Woomer
19,058
55.97%
 William M. Breslin
13,993
41.10%
 Ezra Grumbine
998
2.93%
Nov 04, 1890 General Election
 John W. Rife(I)
17,795
54.75%
 William L. Gorgas
14,308
44.02%
 George W. Campbell
397
1.22%
Nov 06, 1888 General Election
 John W. Rife
20,206
58.34%
 Abraham Bower
13,944
40.26%
 J. Henry Spicer
485
1.40%
Date Type Results
Nov 02, 1886 General Election
 Franklin Bound(I)
17,116
51.86%
 James H. McDevitt
14,485
43.89%
 J.J. Nissley
1,404
4.25%
Nov 04, 1884 General Election
 Franklin Bound
20,767
57.65%
 William Foster
15,256
42.35%
Nov 07, 1882 General Election
 Samuel F. Barr(I)
14,184
46.34%
 Henry McCormick
14,039
45.87%
 John McCleery
1,870
6.11%
 Simeon Brownewell
516
1.69%
Nov 02, 1880 General Election
 Samuel F. Barr
18,320
52.69%
 Grant Weldman
15,771
45.36%
 J. Adam Cake
680
1.96%
Nov 05, 1878 General Election
 John W. Killinger(I)
13,660
46.06%
 M.J. Withington
12,033
40.58%
 Daniel D. Earley
3,962
13.36%
Nov 07, 1876 General Election
 John W. Killinger
16,453
53.57%
 William B. Wilson
13,723
44.68%
 H.C. Deming
535
1.74%
Date Type Results
Nov 03, 1874 General Election
 John B. Packer(I)
12,528
56.43%
 William M. Breslin
9,673
43.57%
Date Type Results
Oct 08, 1872 General Election
 John B. Packer(I)
17,545
56.54%
 Abner Rutherford
13,486
43.46%
Oct 11, 1870 General Election
 John B. Packer(I)
13,620
54.73%
 E. Greenough Scott
11,266
45.27%
Oct 13, 1868 General Election
 John B. Packer
15,598
54.73%
 Joseph F. Knipe
12,902
45.27%
Oct 09, 1866 General Election
 George F. Miller(I)
14,189
52.82%
 Thomas Bower
12,676
47.18%
Oct 10, 1864 General Election
 George F. Miller
11,619
51.16%
 William H. Miller(I)
11,092
48.84%
Oct 14, 1862 General Election
 William H. Miller
10,630
51.26%
 John J. Patterson
10,109
48.74%
Date Type Results
Oct 09, 1860 General Election
 Galusha A. Grow(I)
14,922
71.38%
 Daniel L. Sherwood
5,984
28.62%
Oct 12, 1858 General Election
 Galusha A. Grow(I)
11,165
76.87%
 Joel Parkhurst
3,359
23.13%
Oct 14, 1856 General Election
 Galusha A. Grow(I)
13,325
71.31%
 Daniel L. Sherwood
5,361
28.69%
Oct 09, 1854 General Election
 Galusha A. Grow(I)
13,062
95.22%
 Jim Grow
625
4.56%
 Olin L. Hawley
31
0.23%
Oct 12, 1852 General Election
 Galusha A. Grow(I)
8,062
94.22%
 George F. Horton
495
5.78%
Date Type Results
Oct 08, 1850 General Election
 Thomas M. Bibighaus
7,048
53.62%
 William D. Boas
6,097
46.38%
Oct 10, 1848 General Election
 Charles W. Pitman
10,203
58.08%
 William M. Dock
7,364
41.92%
Oct 13, 1846 General Election
 George N. Eckert
5,694
52.60%
 Mercer Brown
4,577
42.28%
 F.M. Wynkoop
554
5.12%
Date Type Results
Oct 08, 1844 General Election
 Alexander Ramsey(I)
7,915
51.51%
 Augustine Holmes
7,451
48.49%
Oct 10, 1843 General Election
 Alexander Ramsey
5,898
52.64%
 David Umberger
5,307
47.36%
Date Type Results
Oct 13, 1840 General Election
 James Irvin
6,210
52.42%
 A. Porter Wilson
5,636
47.58%
Date Type Results
Nov 20, 1839 Special Election
 George McCulloch
4,094
50.86%
 James Irvin
3,956
49.14%
Oct 09, 1838 General Election
 William W. Potter(I)
6,510
50.87%
 William Irvin
6,288
49.13%
Oct 11, 1836 General Election
 William W. Potter
4,914
59.64%
 John Williamson
3,144
38.16%
 John Ashman
181
2.20%
Oct 14, 1834 General Election
 Joseph Henderson(I)
4,239
52.53%
 James Milliken
3,830
47.47%
Oct 09, 1832 General Election
 Joseph Henderson
4,431
52.87%
 James Milliken
3,950
47.13%
Date Type Results
Oct 12, 1830 General Election
 Andrew Stewart
3,345
54.31%
 Thomas Irwin(I)
2,814
45.69%
Oct 14, 1828 General Election
 Thomas Irwin
3,247
56.27%
 Andrew Stewart(I)
2,523
43.73%
Oct 10, 1826 General Election
 Andrew Stewart(I)
3,562
75.21%
 Joshua Hart
1,174
24.79%
Oct 12, 1824 General Election
 Andrew Stewart(I)
2,719
100.00%
Oct 08, 1822 General Election
 Andrew Stewart(I)
2,889
60.77%
 Joseph Houston
1,865
39.23%
Date Type Results
Oct 01, 1822 Special Election
 Walter Forward
2,676
58.21%
 Ephraim Pentland
1,921
41.79%
Oct 10, 1820 General Election
 Henry Baldwin(I)
2,973
63.83%
 William Marks
1,685
36.17%
Oct 13, 1818 General Election
 Henry Baldwin(I)
2,315
55.13%
 Samuel Douglas
1,884
44.87%
Oct 08, 1816 General Election
 Henry Baldwin
2,139
61.55%
 Walter Lowrie
1,336
38.45%
Oct 11, 1814 General Election
 John Woods
1,413
50.48%
 Adamson Tannehill(I)
1,386
49.52%
Oct 13, 1812 General Election
 Adamson Tannehill
1,419
48.02%
 John Woods
1,162
39.32%
 John Wilson
374
12.66%

DISCUSSION
[Download as CSV]