|
|
"A collaborative political resource." |
Ottawa West—Nepean - History
 | Parliament DETAILS |
|
|
| Parents |
> Canada > Ontario > ON House of Commons
|
 |
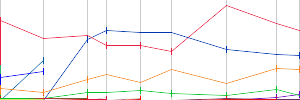
Raw Vote Total:

Percentages:

|
| Website | |
| Established | June 02, 1997 |
| Disbanded | Still Active |
| Last Modified | Campari_007 November 17, 2020 08:33am |
| Description | This urban riding along the shores of the Ottawa River and Lac Deschênes takes in a lot of what was the city of Nepean, now part of Ottawa.
Its boundaries are Riddell Drive, March Valley Road, Herzberg Road and March Road in the west, Highway 417, Richmond Road and the CN line in the south and Rideau River, Baseline Road, Merivale Road, Highway 417 and Sherbourne Road in the east. It includes the Bayshore, Crystal Beach, Crystal Bay, Britannia, Carlington and Lincoln Heights districts.
Dwellings are almost equally split between rentals and owned. The federal government is the largest employer. Average family income is $76,580 and unemployment is 6.8 per cent. More than 28 per cent of residents are immigrants with significant Italian and Chinese communities.
Ottawa West-Nepean was created in 1996 from 72 per cent of Ottawa West and 46 per cent of Nepean. In 2004, small areas of Nepean-Carleton and Lanark-Carleton were added.
Population: 103,870 |
 | RACES |
|
|
| Date |
Type |
Results
[Show Primaries]
|
| Sep 20, 2021 |
General Election |
| | Anita Vandenbeld(I)
25,889
45.10%
|
| Jennifer Jennekens
16,473
28.70%
|
| Yavar Hameed
11,163
19.45%
|
| David Yeo
1,908
3.32%
|
| David Stibbe
1,642
2.86%
|
| Sean J. Mulligan
327
0.57%
|
|
| Oct 21, 2019 |
General Election |
| | Anita Vandenbeld(I)
28,378
45.62%
|
| Abdul Abdi
16,876
27.13%
|
| Angella MacEwen
11,646
18.72%
|
| David Stibbe
3,894
6.26%
|
| Serge Guevorkian
839
1.35%
|
| Sean J. Mulligan
351
0.56%
|
| Vincent Cama
103
0.17%
|
| | | Butch Moore
71
0.11%
|
| Nick Lin
48
0.08%
|
|
| Oct 19, 2015 |
General Election |
| | Anita Vandenbeld
35,199
55.95%
|
| Abdul Abdi
18,893
30.03%
|
| Marlene Rivier
6,195
9.85%
|
| Mark Brooks
1,772
2.82%
|
| Rod Taylor
740
1.18%
|
| Sam Heaton
114
0.18%
|
|
| May 02, 2011 |
General Election |
| | John Baird(I)
25,189
44.56%
|
| Anita Vandenbeld
17,802
31.49%
|
| Marlene Rivier
11,159
19.74%
|
| Mark MacKenzie
2,376
4.20%
|
|
| Oct 14, 2008 |
General Election |
| | John Baird(I)
25,109
44.98%
|
| David Pratt
20,161
36.12%
|
| Marlene Rivier
6,432
11.52%
|
| Frances Coates
3,558
6.37%
|
| David Page
414
0.74%
|
| Alex McDonald
150
0.27%
|
|
| Jan 23, 2006 |
General Election |
| | John Baird
25,607
43.07%
|
| Lee Farnworth
20,250
34.06%
|
| Marlene Rivier
9,626
16.19%
|
| Neil Adair
2,941
4.95%
|
| John Pacheco
905
1.52%
|
| Randy Bens
121
0.20%
|
|
| Jun 28, 2004 |
General Election |
| | Marlene Catterall(I)
23,971
41.78%
|
| Sean Casey
22,591
39.37%
|
| Marlene Rivier
7,449
12.98%
|
| Neil Adair
2,748
4.79%
|
| Russell Barth
430
0.75%
|
| Mary-Sue Haliburton
121
0.21%
|
| Alexandre Legeais
68
0.12%
|
|
| Nov 27, 2000 |
General Election |
| | Marlene Catterall(I)
22,607
43.32%
|
| Barry Yeates
14,753
28.27%
|
| Tom Curran
10,506
20.13%
|
| Kevin Kinsella
2,718
5.21%
|
| Matt Takach
585
1.12%
|
| Sotos Petrides
423
0.81%
|
| David Creighton
376
0.72%
|
| | | John C. Turmel
89
0.17%
|
| Stuart Ryan
70
0.13%
|
| Richard Michael Wolfson
58
0.11%
|
|
| Jun 02, 1997 |
General Election |
| | Marlene Catterall(I)
29,511
54.02%
|
| Barry Yeates
11,601
21.23%
|
| Margaret Kopala
8,489
15.54%
|
| Wendy Byrne
4,163
7.62%
|
| Stuart Langstaff
416
0.76%
|
| John C. Turmel
211
0.39%
|
| Stan Lamothe
153
0.28%
|
| | | Marsha Fine
90
0.16%
|
|
|

|

