Home About Chat Users Issues Party Candidates Polling Firms Media News Polls Calendar Key Races United States President Senate House Governors International

New User Account
"A comprehensive, collaborative elections resource." 
Email: Password:

  KY - District 01 - History
House of Representatives DETAILS
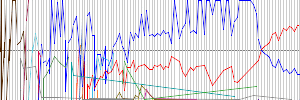
Parents > United States > Kentucky > KY - District 01   Raw Vote Total:

Percentages:

Website
Established January 03, 1803
Disbanded Still Active
Last Modifiededdy 9_99 March 04, 2006 04:24pm
Description

RACES [Don't Show Primaries]
Redistricting: Light Green=Added Territory, Red=Removed Territory,
Dark Green=Kept Territory
Date Type Results
Nov 05, 2024 General Election
 Erin Marshall
0
0.00%
 James R. Comer(I)
0
0.00%
Nov 08, 2022 General Election
 James R. Comer(I)
184,157
74.90%
 Jimmy Ausbrooks
61,701
25.10%
Date Type Results
Nov 03, 2020 General Election
 James R. Comer(I)
246,329
74.99%
 James Rhodes
82,141
25.01%
Nov 06, 2018 General Election
 James R. Comer(I)
172,167
68.59%
 Paul Walker
78,849
31.41%
May 22, 2018 Primary Election
 Paul Walker
51,094
74.60%
 Alonzo Pennington
17,398
25.40%
Nov 08, 2016 General Election
 James R. Comer
216,959
72.56%
 Sam Gaskins
81,710
27.33%
 Terry McIntosh (W)
332
0.11%
Nov 08, 2016 Special Election
 James R. Comer
209,807
72.19%
 Sam Gaskins
80,813
27.81%
May 17, 2016 Primary Election
 James R. Comer
24,342
60.59%
 Michael Pape
9,357
23.29%
 Jason Batts
5,578
13.88%
 Miles A. Caughey
896
2.23%
Nov 04, 2014 General Election
 Edward Whitfield(I)
173,022
73.12%
 Charles K. Hatchett
63,596
26.88%
May 20, 2014 Primary Election
 Charles K. Hatchett
38,055
55.49%
 Wesley Seaton Bolin
30,528
44.51%
Nov 06, 2012 General Election
 Edward Whitfield(I)
199,956
69.64%
 Charles K. Hatchett
87,190
30.36%
May 22, 2012 Primary Election
 Charles K. Hatchett
19,127
59.10%
 James Buckmaster
13,239
40.90%
Date Type Results
Nov 02, 2010 General Election
 Edward Whitfield(I)
153,519
71.25%
 Charles K. Hatchett
61,960
28.75%
Nov 04, 2008 General Election
 Edward Whitfield(I)
178,107
64.35%
 Heather Ryan
98,674
35.65%
Nov 07, 2006 General Election
 Edward Whitfield(I)
123,618
59.58%
 Thomas J. Barlow III
83,865
40.42%
May 16, 2006 Primary Election
 Thomas J. Barlow III
80,594
77.06%
 Eric Streit
16,320
15.60%
 Jim Bloink
7,668
7.33%
Nov 02, 2004 General Election
 Edward Whitfield(I)
175,972
67.37%
 Billy Cartwright
85,229
32.63%
Nov 05, 2002 General Election
 Edward Whitfield(I)
117,600
65.25%
 Klint Alexander
62,617
34.75%
Date Type Results
Nov 07, 2000 General Election
 Edward Whitfield(I)
132,115
57.97%
 Brian S. Roy
95,806
42.03%
May 23, 2000 Primary Election
 Edward Whitfield(I)
12,013
83.83%
 David Lynn Williams
2,317
16.17%
Nov 03, 1998 General Election
 Edward Whitfield(I)
95,308
55.18%
 Thomas J. Barlow III
77,402
44.82%
Nov 05, 1996 General Election
 Edward Whitfield(I)
111,473
53.55%
 Dennis L. Null
96,684
46.45%
May 28, 1996 Primary Election
 Dennis L. Null
30,090
60.30%
 Henry "Ramsey" Morris, Jr.
19,813
39.70%
Nov 08, 1994 General Election
 Edward Whitfield
64,849
50.97%
 Thomas J. Barlow III(I)
62,387
49.03%
May 24, 1994 Primary Election
 Edward Whitfield
4,212
52.53%
 Steve Hamrick
3,807
47.47%
May 24, 1994 Primary Election
 Thomas J. Barlow III(I)
34,505
59.61%
 Henry G. Lackey
18,936
32.71%
 Charles T. Banken
4,442
7.67%
Nov 03, 1992 General Election
 Thomas J. Barlow III
128,524
60.46%
 Steve Hamrick
83,088
39.09%
 Marvin Seat
962
0.45%
May 19, 1992 Primary Election
 Thomas J. Barlow III
40,014
48.08%
 Carroll Hubbard Jr.(I)
37,188
44.69%
 Charles T. Banken
6,019
7.23%
Date Type Results
Nov 06, 1990 General Election
 Carroll Hubbard Jr.(I)
85,323
86.89%
 Marvin Seat
12,879
13.11%
Nov 08, 1988 General Election
 Carroll Hubbard Jr.(I)
117,288
95.05%
 Charles K. Hatchett
6,106
4.95%
May 24, 1988 Primary Election
 Carroll Hubbard Jr.(I)
63,136
73.17%
 Lacey T. Smith
23,153
26.83%
Nov 04, 1986 General Election
 Carroll Hubbard Jr.(I)
64,315
100.00%
May 27, 1986 Primary Election
 Carroll Hubbard Jr.(I)
63,141
80.71%
 Thomas J. Barlow III
15,088
19.29%
Nov 06, 1984 General Election
 Carroll Hubbard Jr.(I)
112,180
100.00%
Nov 02, 1982 General Election
 Carroll Hubbard Jr.(I)
48,342
100.00%
Date Type Results
Nov 04, 1980 General Election
 Carroll Hubbard Jr.(I)
118,565
100.00%
Nov 07, 1978 General Election
 Carroll Hubbard Jr.(I)
44,090
99.98%
  Others (W)
7
0.02%
Nov 02, 1976 General Election
 Carroll Hubbard Jr.(I)
118,886
82.00%
 Bob Bersky
26,089
18.00%
May 25, 1976 Primary Election
 Bob Bersky
2,111
59.70%
 Arthur Lee McLaughlin
1,425
40.30%
Nov 05, 1974 General Election
 Carroll Hubbard Jr.
70,723
78.18%
 Charles T. Banken
16,937
18.72%
 Robert W. Yoak
2,805
3.10%
May 28, 1974 Primary Election
 Charles T. Banken
893
40.48%
 Bob Bersky
736
33.36%
 Arthur Lee McLaughlin
577
26.16%
May 28, 1974 Primary Election
 Carroll Hubbard Jr.
30,034
50.53%
 Frank Stubblefield(I)
29,405
49.47%
Nov 07, 1972 General Election
 Frank Stubblefield(I)
81,456
64.82%
 Charles T. Banken
42,286
33.65%
 John M. Katterjohn
1,920
1.53%
May 23, 1972 Primary Election
 Frank Stubblefield(I)
26,859
72.97%
 Kenneth A. Burkhart
8,582
23.32%
 Charles "Ed" Tandy
1,365
3.71%
Date Type Results
Nov 03, 1970 General Election
 Frank Stubblefield(I)
27,829
100.00%
May 26, 1970 Primary Election
 Frank Stubblefield(I)
20,401
71.83%
 Bobby Joe Sims
7,999
28.17%
Nov 05, 1968 General Election
 Frank Stubblefield(I)
72,072
100.00%
May 28, 1968 Primary Election
 Frank Stubblefield(I)
27,930
69.56%
 Paul J. Durbin
11,284
28.10%
 Edwin E. Coleman
522
1.30%
 Conrad Stinson
416
1.04%
Nov 08, 1966 General Election
 Frank Stubblefield(I)
57,736
70.56%
 Richard Nicholson
24,085
29.44%
May 24, 1966 Primary Election
 Frank Stubblefield(I)
22,330
86.96%
 Lloyd A. Wilson
3,347
13.04%
Date Type Results
Nov 03, 1964 General Election
 Frank Stubblefield(I)
84,574
100.00%
May 26, 1964 Primary Election
 Frank Stubblefield(I)
24,300
87.12%
 Bob Watkins
2,315
8.30%
 Louis P. McHenry
1,276
4.57%
Nov 06, 1962 General Election
 Frank Stubblefield(I)
53,240
100.00%
May 29, 1962 Primary Election
 Frank Stubblefield(I)
25,146
71.59%
 Noble J. Gregory
9,978
28.41%
Date Type Results
Nov 08, 1960 General Election
 Frank Stubblefield(I)
66,248
100.00%
Nov 04, 1958 General Election
 Frank Stubblefield
41,214
85.02%
 James G. Bandy
7,263
14.98%
May 27, 1958 Primary Election
 Frank Stubblefield
16,216
47.48%
 Noble J. Gregory(I)
15,875
46.48%
 L. A. Williams
945
2.77%
 John Otis Pasco
926
2.71%
 Harry Lessley
192
0.56%
Nov 06, 1956 General Election
 Noble J. Gregory(I)
75,726
100.00%
May 29, 1956 Primary Election
 Noble J. Gregory(I)
35,352
65.40%
 Elwood Gordon
18,702
34.60%
Date Type Results
Nov 02, 1954 General Election
 Noble J. Gregory(I)
62,210
100.00%
Nov 04, 1952 General Election
 Noble J. Gregory
66,106
65.80%
 W. Mallam Lake
34,360
34.20%
Date Type Results
Nov 07, 1950 General Election
 Noble J. Gregory(I)
34,970
100.00%
Nov 02, 1948 General Election
 Noble J. Gregory(I)
50,720
100.00%
Aug 07, 1948 Primary Election
 Noble J. Gregory(I)
15,684
61.71%
 Charles E. Gordon
8,566
33.70%
 T. E. Bell, Sr.
1,167
4.59%
Nov 05, 1946 General Election
 Noble J. Gregory(I)
32,121
66.22%
 William E. Porter
16,064
33.12%
 Joseph S. Freeland
320
0.66%
Nov 07, 1944 General Election
 Noble J. Gregory(I)
51,369
69.30%
 A. R. Anderson
22,196
29.94%
 Hubert H. Jones
396
0.53%
 Joseph S. Freeland
164
0.22%
Aug 05, 1944 Primary Election
 Noble J. Gregory(I)
10,079
64.10%
 Walter Parr
4,965
31.57%
 M. E. Gilbert
376
2.39%
 Marion J. McCarthy
305
1.94%
Nov 03, 1942 General Election
 Noble J. Gregory(I)
17,027
67.51%
 Walter L. Prince
8,195
32.49%
Nov 05, 1940 General Election
 Noble J. Gregory(I)
60,777
100.00%
Aug 03, 1940 Primary Election
 Noble J. Gregory(I)
20,257
64.91%
 H. G. Bryan
8,139
26.08%
 Kerby Jennings
2,811
9.01%
Nov 08, 1938 General Election
 Noble J. Gregory(I)
35,332
76.01%
 Alvin H. Schutz
11,153
23.99%
Nov 03, 1936 General Election
 Noble J. Gregory
58,265
71.91%
 Robert N. Brumfield
22,757
28.09%
Aug 01, 1936 Primary Election
 Robert N. Brumfield
4,896
52.46%
 C. H. Lowry
4,436
47.54%
Aug 01, 1936 Primary Election
 William V. Gregory(I)
31,268
62.95%
 V. A. Phillips
18,405
37.05%
Nov 06, 1934 General Election
 William V. Gregory(I)
18,895
61.14%
 John W. Taylor
12,008
38.86%
Aug 04, 1934 Primary Election
 William V. Gregory(I)
21,587
60.83%
 R. S. Mason
13,899
39.17%
Date Type Results
Nov 04, 1930 General Election
 William V. Gregory(I)
24,632
100.00%
Nov 06, 1928 General Election
 William V. Gregory(I)
36,325
56.84%
 Miller Hughes
27,581
43.16%
Aug 04, 1928 Primary Election
 William V. Gregory(I)
15,388
56.36%
 Garth K. Ferguson
11,915
43.64%
Nov 02, 1926 General Election
 William V. Gregory
28,306
67.77%
 Mrs. William H. Mason
13,460
32.23%
Aug 07, 1926 Primary Election
 William V. Gregory
9,838
46.89%
 Garth K. Ferguson
9,654
46.01%
 Harry Green
1,490
7.10%
Nov 04, 1924 General Election
 Alben W. Barkley(I)
41,861
66.95%
 R. L. Myre
20,669
33.05%
Nov 07, 1922 General Election
 Alben W. Barkley(I)
9,492
69.96%
 F. M. McCain
4,075
30.04%
Nov 02, 1920 General Election
 Alben W. Barkley(I)
50,635
64.34%
 Miller Hughes
28,070
35.66%
Aug 07, 1920 Primary Election
 Miller Hughes
2,809
76.96%
 J. B. Jones
841
23.04%
Nov 05, 1918 General Election
 Alben W. Barkley(I)
19,998
66.78%
 W. G. Howard
9,947
33.22%
Nov 07, 1916 General Election
 Alben W. Barkley(I)
30,029
63.67%
 George P. Thomas
16,128
34.20%
 I. O. Ford
840
1.78%
 J. B. McDowell
164
0.35%
Nov 03, 1914 General Election
 Alben W. Barkley(I)
18,407
65.90%
 Edwin Farley
8,522
30.51%
 I. A. Wasson
687
2.46%
 Max M. Hanberry
315
1.13%
Nov 05, 1912 General Election
 Alben W. Barkley
22,591
64.47%
 Charles Furgeson
10,664
30.43%
 I. O. Ford
1,787
5.10%
Date Type Results
Nov 08, 1910 General Election
 Ollie Murray James(I)
11,574
89.28%
 C. L. Harney
1,389
10.72%
Nov 03, 1908 General Election
 Ollie Murray James(I)
27,669
64.07%
 Jerry M. Porter
15,189
35.17%
 I. O. Ford
210
0.49%
 J. W. Graham
118
0.27%
Nov 06, 1906 General Election
 Ollie Murray James(I)
12,870
85.87%
 J. D. Smith
2,118
14.13%
Nov 08, 1904 General Election
 Ollie Murray James(I)
25,558
62.70%
 Jesse C. Spaight
13,755
33.75%
 T. E. Richey
862
2.11%
 J. C. Lackey
585
1.44%
Nov 04, 1902 General Election
 Ollie Murray James
12,731
66.46%
 C. H. Linn
5,469
28.55%
 J. S. Kirkpatrick
955
4.99%
Nov 06, 1900 General Election
 Charles K. Wheeler(I)
25,264
59.62%
 Ben C. Keys
16,809
39.67%
 James Pile
251
0.59%
 P. C. Ford
52
0.12%
Nov 08, 1898 General Election
 Charles K. Wheeler(I)
10,580
67.75%
 G. W. Reeves
5,036
32.25%
Date Type Results
Nov 03, 1896 General Election
 Charles K. Wheeler
14,808
37.36%
 George P. Thomas
12,842
32.40%
 Ben C. Keys
11,991
30.25%
Nov 06, 1894 General Election
 John K. Hendrick
13,912
49.83%
 Ben C. Keys
10,794
38.66%
 W. J. Chitwood
2,701
9.68%
 Josiah Harris
510
1.83%
Nov 08, 1892 General Election
 William J. Stone(I)
15,295
53.00%
 William Joseph Deboe
8,438
29.24%
 Ben C. Keys
4,686
16.24%
 J. D. Smith
438
1.52%
Nov 04, 1890 General Election
 William J. Stone(I)
9,749
66.87%
 E. F. Frank
3,743
25.68%
 William Curd
1,086
7.45%
Date Type Results
Nov 06, 1888 General Election
 William J. Stone(I)
14,195
58.58%
 Edwin Early
9,553
39.42%
 Josiah Harris
485
2.00%
Nov 02, 1886 General Election
 William J. Stone(I)
9,730
53.44%
 Oscar Turner
8,476
46.56%
Nov 04, 1884 General Election
 William J. Stone
10,503
41.84%
 Oscar Turner(I)
7,440
29.64%
 Henry H. Houston
7,161
28.53%
Nov 07, 1882 General Election
 Oscar Turner(I)
8,705
39.33%
 John R. Grace
7,627
34.46%
 Henry H. Houston
5,803
26.22%
Date Type Results
Nov 02, 1880 General Election
 Oscar Turner(I)
11,448
53.65%
 Rodolphus B. Ratliff
6,318
29.61%
 W. W. Tice
3,572
16.74%
Nov 05, 1878 General Election
 Oscar Turner
6,878
42.87%
 Lawrence S. Trimble
5,611
34.97%
 E. W. Bagby
3,554
22.15%
Nov 07, 1876 General Election
 Andrew R. Boone(I)
10,994
45.11%
 Oscar Turner
7,540
30.94%
 Henry H. Houston
5,835
23.94%
Nov 03, 1874 General Election
 Andrew R. Boone
5,882
45.47%
 Oscar Turner
5,799
44.83%
 T. J. Pickett
1,255
9.70%
Nov 05, 1872 General Election
 Edward Crossland(I)
10,276
64.00%
 Isaac H. Trabue
2,510
15.63%
 Henry H. Houston
1,796
11.19%
 John Martin
1,473
9.17%
Date Type Results
Nov 08, 1870 General Election
 Edward Crossland
7,930
64.38%
 Nathan R. Black
2,982
24.21%
 W. C. Clark
1,405
11.41%
Nov 03, 1868 General Election
 Lawrence S. Trimble(I)
13,608
87.05%
 Charles A. Marshall
1,731
11.07%
 W. D. Johnson
293
1.87%
May 04, 1867 General Election
 Lawrence S. Trimble(I)
9,787
84.61%
 George G. Symes
1,780
15.39%
Aug 07, 1865 General Election
 Lawrence S. Trimble
5,749
61.88%
 C. D. Bradley
3,542
38.12%
Aug 03, 1863 General Election
 Lucien Anderson
4,323
82.44%
 Lawrence S. Trimble
711
13.56%
 Thomas Owens
166
3.17%
  Scattering
44
0.84%
Date Type Results
Jan 20, 1862 Special Election
 Samuel Casey
541
54.05%
 Lawrence S. Trimble
442
44.16%
  Scattering
18
1.80%
Jun 20, 1861 General Election
 Henry Cornelius Burnett(I)
8,988
59.08%
 Lawrence S. Trimble
6,225
40.92%
Aug 01, 1859 General Election
 Henry Cornelius Burnett(I)
11,540
83.70%
 William Morrow
2,248
16.30%
Aug 03, 1857 General Election
 Henry Cornelius Burnett(I)
8,989
75.32%
 Owen Grimes
2,945
24.68%
Aug 06, 1855 General Election
 Henry Cornelius Burnett
9,323
62.03%
 W. G. Hughes
5,708
37.97%
Date Type Results
Aug 01, 1853 General Election
 Linn Boyd(I)
7,585
57.57%
 Jefferson Brown
5,590
42.43%
Aug 04, 1851 General Election
 Linn Boyd(I)
6,286
59.86%
 H. M. McCarty
3,363
32.02%
 Hiram McElroy
853
8.12%
Aug 06, 1849 General Election
 Linn Boyd(I)
5,208
100.00%
Aug 02, 1847 General Election
 Linn Boyd(I)
7,421
63.89%
 Samuel Delaney
4,194
36.11%
Aug 04, 1845 General Election
 Linn Boyd(I)
6,377
97.14%
 B. Small
188
2.86%
Aug 07, 1843 General Election
 Linn Boyd(I)
6,097
56.74%
 George W. Barbour
4,649
43.26%
Date Type Results
Apr 26, 1841 General Election
 Linn Boyd(I)
1
100.00%
Aug 01, 1839 General Election
 Linn Boyd
3,360
41.99%
 Robert A. Patterson
2,513
31.41%
 John L. Murray(I)
2,128
26.60%
Aug 07, 1837 General Election
 John L. Murray
2,921
39.71%
 Linn Boyd(I)
2,547
34.62%
 [FNU] Campbell
1,888
25.67%
Aug 05, 1835 General Election
 Linn Boyd
2,704
40.96%
 John L. Murray
2,502
37.90%
 [FNU] Grundy
1,396
21.15%
Aug 05, 1833 General Election
 Chittenden Lyon
3,017
55.86%
 Linn Boyd
2,263
41.90%
 [FNU] Jones
121
2.24%
Date Type Results
Aug 01, 1831 General Election
 Henry Daniel(I)
4,156
51.74%
 Amos Davis
3,877
48.26%
Aug 03, 1829 General Election
 Henry Daniel(I)
4,091
66.57%
 Micajah Harrison
2,054
33.43%
Aug 06, 1827 General Election
 Henry Daniel
4,163
52.21%
 David Trimble(I)
3,811
47.79%
Aug 02, 1824 General Election
 David Trimble(I)
1
100.00%
Aug 05, 1822 General Election
 David Trimble(I)
1,021
79.77%
 Thomas Fletcher
259
20.23%
Date Type Results
Aug 07, 1820 General Election
 David Trimble(I)
1,615
68.55%
 William P. Fleming
741
31.45%
Aug 03, 1818 General Election
 David Trimble(I)
3,319
58.22%
 Thomas Fletcher
2,382
41.78%
Aug 05, 1816 Special Election
 Thomas Fletcher
3,416
58.94%
 Chilton Allan
2,380
41.06%
Aug 05, 1816 General Election
 David Trimble
3,319
55.26%
 George Stockton
2,687
44.74%
Aug 01, 1814 General Election
 James Clark(I)
1,025
100.00%
Aug 03, 1812 General Election
 James Clark
4,560
100.00%
Date Type Results
Aug 06, 1810 General Election
 Anthony New
5,990
60.33%
 Matthew Lyon(I)
3,938
39.67%
Aug 01, 1808 General Election
 Matthew Lyon(I)
1
100.00%
 Anthony New
0
0.00%
 Samuel Hopkins
0
0.00%
Aug 04, 1806 General Election
 Matthew Lyon(I)
4,484
57.90%
 David Walker
3,261
42.10%
Aug 06, 1804 General Election
 Matthew Lyon(I)
1
100.00%
 Samuel Hopkins
0
0.00%
Aug 02, 1803 General Election
 Matthew Lyon
2,472
51.02%
 David Walker
2,373
48.98%

DISCUSSION
[Download as CSV]