Home About Chat Users Issues Party Candidates Polling Firms Media News Polls Calendar Key Races United States President Senate House Governors International

New User Account
"A comprehensive, collaborative elections resource." 
Email: Password:

  IN - District 02 - History
House of Representatives DETAILS
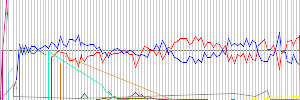
Parents > United States > Indiana > IN - District 02   Raw Vote Total:

Percentages:

Website
Established January 03, 1823
Disbanded Still Active
Last ModifiedRP December 18, 2002 11:39am
Description

RACES [Show Primaries]
Redistricting: Light Green=Added Territory, Red=Removed Territory,
Dark Green=Kept Territory
Date Type Results
Nov 05, 2024 General Election
 Lori Camp
0
0.00%
 Rudolph "Rudy" Yakym III(I)
0
0.00%
Nov 08, 2022 General Election
 Rudolph "Rudy" Yakym III(I)
125,537
64.59%
 Paul D. Steury
62,955
32.39%
 William E. Henry
5,870
3.02%
 Mike Hubbard (W)
11
0.01%
Date Type Results
Nov 08, 2022 Special Election
 Rudolph "Rudy" Yakym III
118,997
63.28%
 Paul D. Steury
62,792
33.39%
 William E. Henry
6,113
3.25%
 Marla Godette (W)
143
0.08%
Nov 03, 2020 General Election
 Jackie Walorski(I)
183,601
61.49%
 Patricia "Pat" Hackett
114,967
38.51%
Nov 06, 2018 General Election
 Jackie Walorski(I)
125,499
54.83%
 Mel Hall
103,363
45.16%
 Richard Wolf (W)
27
0.01%
Nov 08, 2016 General Election
 Jackie Walorski(I)
164,355
59.26%
 Lynn Coleman
102,401
36.92%
 Ronald R. Cenkush
10,601
3.82%
Nov 04, 2014 General Election
 Jackie Walorski(I)
85,583
58.94%
 Joe Bock
55,590
38.29%
 Jeff Petermann
4,027
2.77%
Nov 06, 2012 General Election
 Jackie Walorski
134,033
49.01%
 Brendan Mullen
130,113
47.58%
 Joseph Wayne Ruiz
9,326
3.41%
 Kenneth R. Lunce, Jr. (W)
3
0.00%
Date Type Results
Nov 02, 2010 General Election
 Joe Donnelly(I)
91,341
48.18%
 Jackie Walorski
88,803
46.84%
 Mark Vogel
9,447
4.98%
Nov 04, 2008 General Election
 Joe Donnelly(I)
187,416
67.09%
 Luke Puckett
84,455
30.23%
 Mark Vogel
7,475
2.68%
Nov 07, 2006 General Election
 Joe Donnelly
103,561
53.98%
 J. Chris Chocola(I)
88,300
46.02%
Nov 02, 2004 General Election
 J. Chris Chocola(I)
140,496
54.17%
 Joe Donnelly
115,513
44.54%
 Douglas Barnes
3,346
1.29%
Nov 05, 2002 General Election
 J. Chris Chocola
95,081
50.45%
 Jill Long Thompson
86,253
45.77%
 Sharon Metheny
7,112
3.77%
 James A. Mello (W)
6
0.00%
 Myer Blatt (W)
6
0.00%
Date Type Results
Nov 07, 2000 General Election
 Mike Pence
106,023
50.87%
 Robert W. Rock
80,885
38.81%
 William G. "Bill" Frazier
19,077
9.15%
 Michael E. Anderson
2,422
1.16%
Nov 03, 1998 General Election
 David McIntosh(I)
99,608
60.63%
 Sherman A. Boles
62,452
38.01%
 Cliff Federle
2,236
1.36%
Nov 05, 1996 General Election
 David McIntosh(I)
123,113
57.83%
 R. Marc Carmichael
85,105
39.98%
 Paul E. Zimmerman
4,665
2.19%
Nov 08, 1994 General Election
 David McIntosh
93,592
54.47%
 Joseph H. "Joe" Hogsett
78,241
45.53%
Nov 03, 1992 General Election
 Philip R. Sharp(I)
130,881
57.08%
 William G. "Bill" Frazier
90,593
39.51%
 Theodore "Ted" Shaver
7,821
3.41%
Date Type Results
Nov 06, 1990 General Election
 Philip R. Sharp(I)
93,495
59.37%
 Mike Pence
63,980
40.63%
Nov 08, 1988 General Election
 Philip R. Sharp(I)
116,915
53.20%
 Mike Pence
102,846
46.80%
Nov 04, 1986 General Election
 Philip R. Sharp(I)
102,456
61.86%
 Donald J. Lynch
62,013
37.44%
 Richard Willis Smith
1,156
0.70%
Nov 06, 1984 General Election
 Philip R. Sharp(I)
118,965
53.43%
 Ken MacKenzie
103,061
46.29%
 Cecil Bohanon
637
0.29%
Nov 02, 1982 General Election
 Philip R. Sharp(I)
107,298
56.21%
 Ralph W. VanNatta
83,593
43.79%
Date Type Results
Nov 04, 1980 General Election
 Floyd J. Fithian(I)
122,326
54.06%
 Ernest F. "Ernie" Niemeyer
103,957
45.94%
Nov 07, 1978 General Election
 Floyd J. Fithian(I)
82,402
56.53%
 Jay Philip Oppenheim
52,842
36.25%
 William Costas
9,368
6.43%
 James Hensley Logan
1,166
0.80%
Nov 02, 1976 General Election
 Floyd J. Fithian(I)
117,617
54.75%
 William W. Erwin
95,605
44.50%
 James Hensley Logan
1,623
0.76%
Nov 05, 1974 General Election
 Floyd J. Fithian
101,856
61.06%
 Earl F. Landgrebe(I)
64,950
38.94%
Nov 07, 1972 General Election
 Earl F. Landgrebe(I)
110,406
54.67%
 Floyd J. Fithian
91,533
45.33%
Date Type Results
Nov 03, 1970 General Election
 Earl F. Landgrebe(I)
79,163
50.38%
 Phillip A. Sprague
77,959
49.62%
Nov 05, 1968 General Election
 Earl F. Landgrebe
104,238
55.06%
 Edward F. Kelly
85,084
44.94%
Date Type Results
Nov 08, 1966 General Election
 Charles A. Halleck(I)
91,761
56.09%
 Ralph G. McFadden
71,825
43.91%
Date Type Results
Nov 03, 1964 General Election
 Charles A. Halleck(I)
88,204
52.89%
 John C. Raber
78,566
47.11%
Nov 06, 1962 General Election
 Charles A. Halleck(I)
82,971
57.60%
 John J. Murray
61,076
42.40%
Nov 08, 1960 General Election
 Charles A. Halleck(I)
95,920
57.46%
 George H. Bowers
70,464
42.21%
 Earl F. Dodge Jr.
553
0.33%
Nov 04, 1958 General Election
 Charles A. Halleck(I)
71,933
52.23%
 George H. Bowers
65,792
47.77%
Nov 06, 1956 General Election
 Charles A. Halleck(I)
94,852
62.23%
 Thurman C. Crook
57,049
37.43%
 J.O. Johnston
525
0.34%
Nov 02, 1954 General Election
 Charles A. Halleck(I)
73,717
59.59%
 James H. Berg
49,996
40.41%
Nov 04, 1952 General Election
 Charles A. Halleck(I)
94,795
63.29%
 L. Dewey Burham
54,025
36.07%
 Ross J. McLennan
947
0.63%
Nov 07, 1950 General Election
 Charles A. Halleck(I)
74,872
57.23%
 Dale E. Beck
55,153
42.16%
 Lee R. Cory
797
0.61%
Nov 02, 1948 General Election
 Charles A. Halleck(I)
71,907
55.23%
 Theodore J. Smith
57,245
43.97%
 F.W. Lough
1,032
0.79%
Nov 05, 1946 General Election
 Charles A. Halleck(I)
66,423
61.32%
 Margaret A. Afflis
40,847
37.71%
 F.W. Lowe
1,047
0.97%
Nov 07, 1944 General Election
 Charles A. Halleck(I)
78,061
61.56%
 James Otis Cox
48,103
37.94%
 John W. Root
636
0.50%
Nov 03, 1942 General Election
 Charles A. Halleck(I)
63,120
61.24%
 Emmett Ferguson
39,943
38.76%
Date Type Results
Nov 05, 1940 General Election
 Charles A. Halleck(I)
87,652
58.07%
 James Otis Cox
63,290
41.93%
Nov 08, 1938 General Election
 Charles A. Halleck(I)
79,304
57.82%
 Homer Stonebraker
57,860
42.18%
Nov 03, 1936 General Election
 Charles A. Halleck(I)
73,072
51.51%
 Hugh A. Barnhart
68,318
48.16%
 Winston A. Roberts
257
0.18%
 Silas Goodrich
204
0.14%
Jan 29, 1935 Special Election
 Charles A. Halleck
50,324
52.74%
 George Durgan
45,089
47.26%
Nov 06, 1934 General Election
 Frederick Landis
72,552
53.88%
 George Durgan(I)
61,610
45.75%
 William Earl Ross
491
0.36%
Nov 08, 1932 General Election
 George Durgan
73,357
54.01%
 William R. Wood(I)
61,897
45.57%
 Robert L. McGinley
560
0.41%
Date Type Results
Nov 04, 1930 General Election
 Arthur H. Greenwood(I)
52,452
59.51%
 Ray S. Sisson
35,689
40.49%
Nov 06, 1928 General Election
 Arthur H. Greenwood(I)
45,901
50.15%
 Orville T. Stout
44,941
49.10%
 Zimri B. Gasten
688
0.75%
Nov 02, 1926 General Election
 Arthur H. Greenwood(I)
44,690
55.41%
 John E. Sedwick
35,964
44.59%
Nov 04, 1924 General Election
 Arthur H. Greenwood(I)
43,690
49.83%
 John E. Sedgwick
43,073
49.13%
 Jack Smith
911
1.04%
Nov 07, 1922 General Election
 Arthur H. Greenwood
43,632
50.51%
 Oscar E. Bland(I)
42,752
49.49%
Nov 02, 1920 General Election
 Oscar E. Bland(I)
47,896
52.12%
 William A. Cullop
39,349
42.82%
 Ward A. McBride
2,823
3.07%
 George R. Dutton
1,823
1.98%
Nov 05, 1918 General Election
 Oscar E. Bland(I)
23,943
53.60%
 Fred F. Bays
19,731
44.17%
 Zimn M. Garten
999
2.24%
Nov 07, 1916 General Election
 Oscar E. Bland
24,764
47.34%
 William A. Cullop(I)
23,759
45.42%
 Zimn M. Garten
2,860
5.47%
 H. J. Beddinger
622
1.19%
 Stephen A. Burton
304
0.58%
Nov 03, 1914 General Election
 William A. Cullop(I)
21,451
44.25%
 Oscar E. Bland
19,145
39.49%
 James B. Wilson
5,087
10.49%
 William J. Trout
2,225
4.59%
 George Scruggs
569
1.17%
Nov 05, 1912 General Election
 William A. Cullop(I)
22,082
45.34%
 Oscar E. Bland
15,858
32.56%
 John N. Dyer
6,001
12.32%
 John L. Shepherd
3,888
7.98%
 Isaac C. Overman
873
1.79%
Date Type Results
Nov 08, 1910 General Election
 William A. Cullop(I)
22,960
48.44%
 Oscar E. Bland
21,419
45.19%
 Zimry Garton
2,322
4.90%
 Elijah Eddington
700
1.48%
Nov 03, 1908 General Election
 William A. Cullop
27,172
49.97%
 John C. Chaney(I)
24,609
45.26%
 George W. Lackey
1,821
3.35%
 John A. Rowe
684
1.26%
 John McMillin
86
0.16%
 Samuel S. Doman
6
0.01%
Nov 06, 1906 General Election
 John C. Chaney(I)
22,299
48.68%
 Cyrus E. Davis
21,889
47.78%
 William H. Hill
839
1.83%
 John E. Chinn
781
1.70%
Nov 08, 1904 General Election
 John C. Chaney
25,143
49.70%
 Robert W. Miers(I)
23,670
46.79%
 John Wadsworth
797
1.58%
 Alexander P. Asbury
777
1.54%
 Jacob W. Clark
204
0.40%
Nov 04, 1902 General Election
 Robert W. Miers(I)
21,162
49.46%
 John C. Chaney
20,423
47.73%
 Jonathan T. Hobson
672
1.57%
 James C. Heenan
332
0.78%
 William B. Wolfe
199
0.47%
Date Type Results
Nov 06, 1900 General Election
 Robert W. Miers(I)
24,420
51.82%
 Peter R. Wadsworth
21,799
46.25%
 William H. Crowder
513
1.09%
 Charles F. Preslar
396
0.84%
Nov 08, 1898 General Election
 Robert W. Miers(I)
20,245
50.32%
 William R. Gardiner
18,656
46.37%
 William J. Trout
1,333
3.31%
Nov 03, 1896 General Election
 Robert W. Miers
21,757
48.20%
 Alexander M. Hardy(I)
20,759
45.99%
 Newel H. Motsinger
2,625
5.82%
Date Type Results
Nov 06, 1894 General Election
 Alexander M. Hardy
17,624
47.56%
 John L. Bretz(I)
15,896
42.90%
 Elisha A. Riggins
3,217
8.68%
 William J. Trout
318
0.86%
Nov 08, 1892 General Election
 John L. Bretz(I)
17,700
47.93%
 Ben L. Willoughby
15,731
42.60%
 Merrick W. Ackerly
3,010
8.15%
 L. L. Cooper
485
1.31%
Date Type Results
Nov 04, 1890 General Election
 John L. Bretz
14,697
46.35%
 William N. Darnell
11,996
37.83%
 Sampson Cox
4,649
14.66%
 Anderson F. Fox
369
1.16%
Nov 06, 1888 General Election
 John H. O'Neall(I)
18,537
52.33%
 Thomas N. Braxton
16,653
47.01%
 Garland Bluett
234
0.66%
Nov 02, 1886 General Election
 John H. O'Neall
16,075
51.81%
 M. S. Ragsdale
14,871
47.93%
 Garland Bluett
83
0.27%
Date Type Results
Nov 04, 1884 General Election
 Thomas Reed Cobb(I)
18,832
55.45%
 George H. Reiley
15,128
44.55%
Nov 07, 1882 General Election
 Thomas Reed Cobb(I)
16,339
55.15%
 Abraham J. Hostetler
13,288
44.85%
Nov 02, 1880 General Election
 Thomas Reed Cobb(I)
18,443
54.29%
 James Braden
14,676
43.20%
 John C. Albert
852
2.51%
Date Type Results
Oct 07, 1878 General Election
 Thomas Reed Cobb(I)
17,317
55.06%
 Richard M. Welman
12,032
38.26%
 William L. Green
2,103
6.69%
Oct 10, 1876 General Election
 Thomas Reed Cobb
18,888
57.90%
 Louis T. Loveless
13,735
42.10%
Oct 10, 1876 Special Election
 Andrew Humphreys
17,250
51.29%
 William F. Spicely
15,458
45.96%
 W. T. Crawford
925
2.75%
Oct 13, 1874 General Election
 James Douglas Williams
17,395
64.56%
 Levi Ferguson
9,088
33.73%
 B. F. Rawlins
461
1.71%
Date Type Results
Oct 08, 1872 General Election
 Simeon K. Wolfe
19,336
58.62%
 D. W. Voyles
13,652
41.38%
Oct 11, 1870 General Election
 Michael C. Kerr(I)
16,950
60.39%
 George W. Carr
11,117
39.61%
Oct 13, 1868 General Election
 Michael C. Kerr(I)
18,779
60.34%
 Walter Q. Gresham
12,343
39.66%
Date Type Results
Oct 09, 1866 General Election
 Michael C. Kerr(I)
13,421
53.47%
 Walter Q. Gresham
11,678
46.53%
Oct 10, 1864 General Election
 Michael C. Kerr
11,357
55.61%
 William W. Curry
9,064
44.39%
Oct 14, 1862 General Election
 James A. Cravens(I)
10,911
63.73%
 J. G. May
6,211
36.27%
Oct 09, 1860 General Election
 James A. Cravens
10,811
51.28%
 John S. Davis
10,272
48.72%
Oct 12, 1858 General Election
 William H. English(I)
9,293
55.56%
 John M. Wilson
7,434
44.44%
Oct 14, 1856 General Election
 William H. English(I)
10,577
57.16%
 John M. Wilson
7,927
42.84%
Oct 10, 1854 General Election
 William H. English(I)
8,931
51.70%
 Thomas C. Slaughter
8,345
48.30%
Oct 12, 1852 General Election
 William H. English
8,654
54.95%
 J. D. Fergason
7,094
45.05%
Date Type Results
Aug 04, 1851 General Election
 Cyrus L. Dunham(I)
8,097
53.19%
 Roger Martin
7,125
46.81%
Aug 06, 1849 General Election
 Cyrus L. Dunham
7,823
51.60%
 William McKee Dunn
7,338
48.40%
Aug 02, 1847 General Election
 Thomas J. Henley(I)
7,170
50.14%
 John S. Davis
7,130
49.86%
Aug 04, 1845 General Election
 Thomas J. Henley(I)
7,219
53.10%
 Roger Martin
6,376
46.90%
Aug 07, 1843 General Election
 Thomas J. Henley
7,020
53.63%
 Joseph L. White
6,070
46.37%
Date Type Results
May 03, 1841 General Election
 Richard Wigginton Thompson
6,294
52.62%
 James Lockhart
5,668
47.38%
Aug 05, 1839 General Election
 John W. Davis
7,516
54.73%
 John Ewing(I)
6,217
45.27%
Aug 07, 1837 General Election
 John Ewing
5,820
54.36%
 John Law
4,887
45.64%
Aug 03, 1835 General Election
 John W. Davis
5,499
55.33%
 John Ewing(I)
4,440
44.67%
Aug 05, 1833 General Election
 John Ewing
1,921
20.94%
 John W. Davis
1,919
20.92%
 John Law
1,668
18.19%
 George Boon
1,459
15.91%
 William C. Linton
1,183
12.90%
 Hugh L. Livingston
1,022
11.14%
Date Type Results
Aug 05, 1831 General Election
 John Carr
4,854
32.78%
 William W. Wick
4,605
31.09%
 James Brown Ray
1,732
11.69%
 Jonathan Jennings(I)
1,680
11.34%
 John H. Thompson
1,486
10.03%
 Isaac Howk
453
3.06%
Aug 04, 1828 General Election
 Jonathan Jennings(I)
7,659
73.33%
 John H. Thompson
2,785
26.67%
Date Type Results
Aug 07, 1826 General Election
 Jonathan Jennings(I)
7,913
100.00%
Aug 02, 1824 General Election
 Jonathan Jennings(I)
4,680
53.19%
 Jeremiah Sullivan
4,119
46.81%
Aug 05, 1822 General Election
 Jonathan Jennings
3,971
60.35%
 James Scott
2,598
39.48%
 David H. Maxwell
11
0.17%

DISCUSSION
[Download as CSV]