Home About Chat Users Issues Party Candidates Polling Firms Media News Polls Calendar Key Races United States President Senate House Governors International

New User Account
"A comprehensive, collaborative elections resource." 
Email: Password:

  PA - District 06 - History
House of Representatives DETAILS
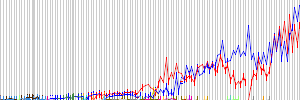
Parents > United States > Pennsylvania > PA - District 06   Raw Vote Total:

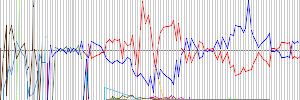
Percentages:

Website
Established March 04, 1791
Disbanded Still Active
Last ModifiedRP April 29, 2011 06:57pm
Description

RACES [Don't Show Primaries]
Redistricting: Light Green=Added Territory, Red=Removed Territory,
Dark Green=Kept Territory
Date Type Results
Nov 05, 2024 General Election
 Chrissy Houlahan(I)
231,658
56.00%
 Neil Young
182,006
44.00%
Apr 23, 2024 Primary Election
 Neil Young
45,072
100.00%
Apr 23, 2024 Primary Election
 Chrissy Houlahan(I)
58,552
100.00%
Nov 08, 2022 General Election
 Chrissy Houlahan(I)
190,386
58.31%
 Guy L. Ciarrocchi
136,097
41.69%
May 17, 2022 Primary Election
 Guy L. Ciarrocchi
23,369
33.05%
 Stephen A. Fanelli
21,146
29.91%
 Ronald C. Vogel
15,628
22.10%
 Regina Mauro
10,565
14.94%
Date Type Results
Nov 03, 2020 General Election
 Chrissy Houlahan(I)
226,440
56.05%
 John Emmons
177,526
43.95%
Jun 02, 2020 Primary Election
 John Emmons
56,928
100.00%
Jun 02, 2020 Primary Election
 Chrissy Houlahan(I)
89,411
100.00%
Nov 06, 2018 General Election
 Chrissy Houlahan
177,704
58.88%
 Greg McCauley
124,124
41.12%
May 15, 2018 Primary Election
 Chrissy Houlahan
35,636
100.00%
May 15, 2018 Primary Election
 Greg McCauley
32,375
100.00%
Date Type Results
Nov 08, 2016 General Election
 Ryan A. Costello(I)
207,469
57.24%
 Michael D. Parrish
155,000
42.76%
Apr 26, 2016 Primary Election
 Ryan A. Costello(I)
88,349
100.00%
Apr 26, 2016 Primary Election
 Michael D. Parrish
62,732
100.00%
Nov 04, 2014 General Election
 Ryan A. Costello
119,643
56.29%
 Manan Trivedi
92,901
43.71%
May 20, 2014 Primary Election
 Ryan A. Costello
24,313
100.00%
May 20, 2014 Primary Election
 Manan Trivedi
27,359
100.00%
Nov 06, 2012 General Election
 Jim Gerlach(I)
191,725
57.14%
 Manan Trivedi
143,803
42.86%
Apr 24, 2012 Primary Election
 Manan Trivedi
20,037
100.00%
Apr 24, 2012 Primary Election
 Jim Gerlach(I)
45,206
100.00%
Date Type Results
Nov 02, 2010 General Election
 Jim Gerlach(I)
133,770
57.10%
 Manan Trivedi
100,493
42.90%
May 18, 2010 Primary Election
 Jim Gerlach(I)
35,235
79.82%
 Patrick Henry "Pat" Sellers
8,909
20.18%
May 18, 2010 Primary Election
 Manan Trivedi
21,585
50.73%
 Douglas "Doug" Pike
20,871
49.05%
  Others (W)
96
0.23%
Nov 04, 2008 General Election
 Jim Gerlach(I)
179,423
52.10%
 Bob Roggio
164,952
47.90%
Apr 22, 2008 Primary Election
 Jim Gerlach(I)
39,232
100.00%
Apr 22, 2008 Primary Election
 Bob Roggio
82,540
100.00%
Nov 07, 2006 General Election
 Jim Gerlach(I)
121,047
50.66%
 Lois Murphy
117,892
49.34%
May 16, 2006 Primary Election
 Jim Gerlach(I)
30,088
100.00%
May 16, 2006 Primary Election
 Lois Murphy
22,242
76.16%
 Mike Leibowitz
6,961
23.84%
Nov 02, 2004 General Election
 Jim Gerlach(I)
160,348
51.01%
 Lois Murphy
153,977
48.99%
Apr 27, 2004 Primary Election
 Jim Gerlach(I)
50,809
100.00%
Date Type Results
Nov 05, 2002 General Election
 Jim Gerlach
103,648
51.37%
 Daniel B. "Dan" Wofford
98,128
48.63%
May 21, 2002 Primary Election
 Daniel B. "Dan" Wofford
30,710
62.52%
 Frank Thomas
18,412
37.48%
Date Type Results
Nov 07, 2000 General Election
 T. Timothy "Tim" Holden(I)
140,084
66.29%
 Thomas G. Kopel
71,227
33.71%
  Others (W)
2
0.00%
Nov 03, 1998 General Election
 T. Timothy "Tim" Holden(I)
85,374
61.00%
 John Meckley
54,579
39.00%
Nov 05, 1996 General Election
 T. Timothy "Tim" Holden(I)
115,193
58.55%
 Christian Y. Leinbach
80,061
40.70%
 Thomas E. List
1,475
0.75%
Apr 23, 1996 Primary Election
 T. Timothy "Tim" Holden(I)
21,829
100.00%
Apr 23, 1996 Primary Election
 Christian Y. Leinbach
11,649
40.22%
 Frederick C. "Fred" Levering
6,732
23.24%
 Steve Trautwein
6,327
21.84%
 Thomas G. Kopel
4,256
14.69%
Nov 08, 1994 General Election
 T. Timothy "Tim" Holden(I)
90,023
56.75%
 Frederick C. "Fred" Levering
68,610
43.25%
Nov 03, 1992 General Election
 T. Timothy "Tim" Holden
108,312
52.07%
 John E. Jones
99,694
47.93%
Apr 28, 1992 Primary Election
 T. Timothy "Tim" Holden
20,057
39.41%
 Warren H Haggerty, Jr.
16,647
32.71%
 John A. Reusing
14,193
27.89%
Apr 28, 1992 Primary Election
 John E. Jones
24,201
48.75%
 James J. Gallen
14,498
29.20%
 James P. Troutman
10,947
22.05%
Date Type Results
Nov 06, 1990 General Election
 Gus Yatron(I)
74,394
57.01%
 John F. Hicks
56,093
42.99%
Nov 08, 1988 General Election
 Gus Yatron(I)
114,119
63.14%
 James R. Erwin
65,278
36.12%
 Louis R. Perugini Jr.
1,348
0.75%
Nov 04, 1986 General Election
 Gus Yatron(I)
98,142
69.11%
 Norman W. Bertasavage
43,858
30.89%
Nov 06, 1984 General Election
 Gus Yatron(I)
181,165
100.00%
Apr 10, 1984 Primary Election
 Gus Yatron(I)
40,185
87.76%
 Paul E. Clark
5,604
12.24%
Nov 02, 1982 General Election
 Gus Yatron(I)
108,230
71.97%
 Harry B. Martin
42,155
28.03%
May 18, 1982 Primary Election
 Harry B. Martin
9,508
38.07%
 Norman W. Bertasavage
6,656
26.65%
 Stephen Mazur
5,242
20.99%
 Michael Troyanoski
3,570
14.29%
Date Type Results
Nov 04, 1980 General Election
 Gus Yatron(I)
117,965
67.10%
 George Hulshart
57,844
32.90%
Apr 22, 1980 Primary Election
 George Hulshart
21,918
51.42%
 Harry B. Martin
20,707
48.58%
Nov 07, 1978 General Election
 Gus Yatron(I)
106,431
73.82%
 Stephen Mazur
37,746
26.18%
May 16, 1978 Primary Election
 Stephen Mazur
18,453
54.95%
 George Hulshart
15,127
45.05%
Nov 02, 1976 General Election
 Gus Yatron(I)
133,624
73.83%
 Stephen Postupack
46,103
25.47%
 Garland M. Fisher
1,271
0.70%
Apr 27, 1976 Primary Election
 Stephen Postupack
15,681
63.56%
 Norman W. Bertasavage
8,990
36.44%
Nov 05, 1974 General Election
 Gus Yatron(I)
111,127
74.61%
 Stephen Postupack
35,805
24.04%
 Frank E. Huet
2,020
1.36%
Nov 07, 1972 General Election
 Gus Yatron(I)
119,557
64.48%
 Eugene W. Hubler
64,076
34.56%
 Frank E. Huet
1,775
0.96%
Apr 25, 1972 Primary Election
 Eugene W. Hubler
19,084
56.17%
 John S. Hayes
14,893
43.83%
Date Type Results
Nov 03, 1970 General Election
 Gus Yatron(I)
96,453
65.03%
 Michael Kitsock
48,397
32.63%
 George T. Atkins
3,469
2.34%
May 19, 1970 Primary Election
 Michael Kitsock
15,702
70.71%
 Stephen Mazur
6,503
29.29%
Nov 05, 1968 General Election
 Gus Yatron
94,247
51.43%
 Peter Yonavick
87,090
47.52%
 Joseph G. Brewer
1,914
1.04%
Nov 08, 1966 General Election
 George M. Rhodes(I)
91,538
56.14%
 Daniel B. Boyer, Jr.
71,508
43.86%
Date Type Results
Nov 03, 1964 General Election
 George M. Rhodes(I)
144,697
62.05%
 James B. Bamford
88,495
37.95%
Apr 28, 1964 Primary Election
 James B. Bamford
29,006
62.60%
 Joseph G. Brewer
17,328
37.40%
Nov 06, 1962 General Election
 George M. Rhodes(I)
112,959
51.19%
 Ivor D. Fenton(I)
107,724
48.81%
May 15, 1962 Primary Election
 George M. Rhodes(I)
38,868
76.38%
 John M. Linnet
9,595
18.86%
 Rae Guistwite
2,423
4.76%
Date Type Results
Nov 08, 1960 General Election
 Herman Toll(I)
109,275
59.58%
 David O. Maxwell
74,132
40.42%
Apr 26, 1960 Primary Election
 David O. Maxwell
17,055
62.17%
 J. Warren Keel
10,378
37.83%
Nov 04, 1958 General Election
 Herman Toll
83,491
55.40%
 Fred C. Gartner
67,205
44.60%
Nov 06, 1956 General Election
 Hugh D. Scott, Jr.(I)
90,966
51.54%
 Herbert J. McGlinchey
85,541
48.46%
Apr 24, 1956 Primary Election
 Herbert J. McGlinchey
9,655
57.41%
 Walter Tresville
2,540
15.10%
 Isadore H. Bellis
1,869
11.11%
 Robert E. Scullin
1,102
6.55%
 Lawrence Goldberg
615
3.66%
 John Carey
492
2.93%
 Benjamin S. Altshuler
282
1.68%
  H. Jerome Jaspan
262
1.56%
Nov 02, 1954 General Election
 Hugh D. Scott, Jr.(I)
74,328
50.59%
 Alexander Hemphill
72,587
49.41%
Nov 04, 1952 General Election
 Hugh D. Scott, Jr.(I)
93,368
51.66%
 Harrington Herr
87,124
48.20%
 Anthony Lo Popolo
247
0.14%
Date Type Results
Nov 07, 1950 General Election
 Hugh D. Scott, Jr.(I)
74,316
49.98%
 Ethan A. Doty
73,913
49.71%
 Kenneth R. Forbes
454
0.31%
Nov 02, 1948 General Election
 Hugh D. Scott, Jr.(I)
86,755
56.97%
 Herbert J. McGlinchey
65,535
43.03%
Nov 05, 1946 General Election
 Hugh D. Scott, Jr.
82,671
58.54%
 Herbert J. McGlinchey(I)
58,557
41.46%
Nov 07, 1944 General Election
 Herbert J. McGlinchey
78,123
50.71%
 Hugh D. Scott, Jr.(I)
75,794
49.20%
 Joseph N. Cameron
145
0.09%
Date Type Results
Nov 03, 1942 General Election
 Francis J. Myers(I)
53,284
55.34%
 William H. Sylk
42,995
44.66%
Date Type Results
Nov 05, 1940 General Election
 Francis J. Myers(I)
82,550
61.11%
 Frank F. Truscott
51,313
37.98%
 Harold B. Hatfield
718
0.53%
 Joseph Dougher
315
0.23%
 Edward Gallob
195
0.14%
Nov 08, 1938 General Election
 Francis J. Myers
62,524
49.91%
 J. Howard Berry
59,548
47.53%
 Michael J. Stack(I)
3,205
2.56%
May 18, 1938 Primary Election
 J. Howard Berry
33,554
84.23%
 Michael J. Stoney
6,284
15.77%
May 18, 1938 Primary Election
 Francis J. Myers
20,549
50.16%
 Michael J. Stack(I)
13,932
34.01%
 Louis F. McCabe
4,583
11.19%
 Carl S. Lorine Jr.
1,098
2.68%
 Samuel E. Kratzek
806
1.97%
Nov 03, 1936 General Election
 Michael J. Stack(I)
84,487
61.11%
 George F. Holmes
51,892
37.53%
 Charles Kruger
1,026
0.74%
 Harry Berger
435
0.31%
 Norris Erlichman
361
0.26%
 Albert H. Coggins
52
0.04%
Nov 06, 1934 General Election
 Michael J. Stack
50,977
50.81%
 Robert L. Davis
48,308
48.15%
 John P. Innerarity
612
0.61%
 Ben Gardner
195
0.19%
 Romain C. Hassrick
174
0.17%
 Benjamin J. Spang
56
0.06%
Nov 08, 1932 General Election
 Edward L. Stokes(I)
44,884
51.00%
 Harry V. Dougherty
40,440
45.95%
 M.H. Goldstein
1,996
2.27%
 Charles C. Hopkins
687
0.78%
Date Type Results
Nov 08, 1932 Special Election
 Robert L. Davis
63,929
54.13%
 Leo J. Horton
54,178
45.87%
Nov 04, 1930 General Election
 George A. Welsh(I)
66,799
76.08%
 John B. Boylan
21,004
23.92%
Nov 06, 1928 General Election
 George A. Welsh(I)
89,362
59.77%
 Bruce A. Metzger
59,410
39.73%
 Louis Schorpp
581
0.39%
 M. Jones
165
0.11%
Nov 02, 1926 General Election
 George A. Welsh(I)
51,844
79.39%
 Thomas A. Logue
10,344
15.84%
 Royal Stephens
2,547
3.90%
 Edward Norton
491
0.75%
 Frederick E. Mayer
80
0.12%
Nov 04, 1924 General Election
 George A. Welsh(I)
66,340
74.61%
 Francis I. Coyle
17,457
19.63%
 Edward Norton
3,952
4.44%
 James R. Patten
556
0.63%
 Frank R. Mason
553
0.62%
 Frederick E. Mayer
54
0.06%
Nov 07, 1922 General Election
 George A. Welsh
44,159
73.44%
 Robert J. Sterrett
13,629
22.67%
 Robert Carson
1,183
1.97%
 John W. Quick
1,028
1.71%
 Frederick E. Mayer
127
0.21%
Date Type Results
Nov 02, 1920 General Election
 George P. Darrow(I)
104,576
73.51%
 Harry S. Jeffery
33,363
23.45%
 J.N. Quick
4,140
2.91%
 Unidentified Scattering (W)
181
0.13%
Nov 05, 1918 General Election
 George P. Darrow(I)
42,376
72.14%
 John K. Laughlin
15,722
26.76%
 John Fisler
643
1.09%
Nov 07, 1916 General Election
 George P. Darrow(I)
56,207
67.59%
 J. Washington Logue
25,665
30.86%
 Robert A. Mays
1,292
1.55%
Nov 03, 1914 General Election
 George P. Darrow
38,068
56.06%
 J. Washington Logue(I)
14,656
21.58%
 Frederick S. Drake
13,884
20.44%
 Raymond H. Miller
1,049
1.54%
 I.W. Huckins
253
0.37%
Nov 05, 1912 General Election
 J. Washington Logue
22,091
34.88%
 Frederick S. Drake
19,642
31.01%
 Harry Arista Mackey
19,291
30.46%
 Perry R. Long
1,997
3.15%
 William C. Letson
264
0.42%
 Francis T. Tobin
57
0.09%
Nov 08, 1910 General Election
 George D. McCreary(I)
25,747
46.21%
 Frank H. Hawkins
23,672
42.49%
 William A. Carr
4,319
7.75%
 George A. Murr
1,171
2.10%
 Wharton Barker
621
1.11%
 George B. Cook
182
0.33%
Date Type Results
Nov 03, 1908 General Election
 George D. McCreary(I)
31,129
72.46%
 Frederick J. Bailey
10,205
23.75%
 Charles W. Erwin
907
2.11%
 John M. Doran
721
1.68%
Nov 06, 1906 General Election
 George D. McCreary(I)
38,269
84.64%
 Francis X. Ward
6,425
14.21%
 Hyland W. Potter
518
1.15%
Nov 08, 1904 General Election
 George D. McCreary(I)
34,984
76.71%
 William A. Carr
8,709
19.10%
 John F. Edwards
849
1.86%
 George J. Fielder
561
1.23%
 David M. Barr
500
1.10%
Nov 04, 1902 General Election
 George D. McCreary
30,626
98.39%
 Lewis L. Eavenson
501
1.61%
Date Type Results
Nov 06, 1900 General Election
 Thomas S. Butler(I)
26,379
70.21%
 Nathaniel M. Ellis
10,098
26.88%
 J. Newton Huston
993
2.64%
 Morris E. Shields
101
0.27%
Nov 08, 1898 General Election
 Thomas S. Butler(I)
15,169
53.73%
 John B. Robinson
6,537
23.15%
 William H. Berry
6,513
23.07%
 R.G. Ogden
10
0.04%
  Scattering (W)
3
0.01%
Nov 03, 1896 General Election
 Thomas S. Butler
15,016
39.42%
 John B. Robinson(I)
13,369
35.09%
 William H. Berry
9,288
24.38%
 Jesse G. Yeager
422
1.11%
 R.J. Cornwell
1
0.00%
Nov 06, 1894 General Election
 John B. Robinson(I)
20,717
64.67%
 Thomas E. Parke
9,803
30.60%
 William H. Berry
1,513
4.72%
 Thomas U. Cooper (W)
2
0.01%
Nov 08, 1892 General Election
 John B. Robinson(I)
19,129
55.29%
 Garrett C. Smedley
13,938
40.29%
 Daniel G. Hendricks
1,530
4.42%
 Thomas Jones (W)
1
0.00%
Nov 04, 1890 General Election
 John B. Robinson
17,447
54.98%
 Thomas W. Pierce
13,342
42.05%
 J. Simmons Kent
939
2.96%
  Scattering
4
0.01%
Nov 06, 1888 General Election
 Smedley Darlington(I)
19,299
58.06%
 Samuel Greenwood
12,799
38.50%
 George Drayton
1,133
3.41%
  Scattering
11
0.03%
Date Type Results
Nov 02, 1886 General Election
 Smedley Darlington
11,841
41.38%
 Oliver B. Dickinson
10,529
36.80%
 James B. Everhart(I)
4,966
17.36%
 Ellis P. Marshall
1,270
4.44%
  Scattering
7
0.02%
Nov 04, 1884 General Election
 James B. Everhart(I)
18,593
60.45%
 Frederick W. Heckel
11,551
37.56%
 George B. Passmore
607
1.97%
  Scattering
5
0.02%
Nov 07, 1882 General Election
 James B. Everhart
14,615
59.02%
 J. Edward Clyde
9,810
39.61%
 Elijah F. Pennypacker
316
1.28%
 William Allcutt
21
0.08%
 William B. Waddell
2
0.01%
Nov 02, 1880 General Election
 William Ward(I)
18,368
60.35%
 R. Jones Monaghan
11,847
38.93%
 Samuel Cornett
218
0.72%
 William Wayne (W)
1
0.00%
Nov 05, 1878 General Election
 William Ward(I)
13,041
57.77%
 Bethel M. Custer
8,285
36.70%
 John Hibberd
709
3.14%
 Elijah F. Pennypacker
538
2.38%
 William Godschalk
1
0.00%
Nov 07, 1876 General Election
 William Ward
15,220
60.88%
 William D. Hartman
9,717
38.87%
 Elijah F. Pennypacker
62
0.25%
Date Type Results
Nov 03, 1874 General Election
 Washington Townsend(I)
9,485
57.39%
 J. Larkin Forwod
6,916
41.85%
 William D. Hartman
125
0.76%
 J.P. Edge
1
0.01%
Date Type Results
Oct 08, 1872 General Election
 James S. Biery
13,906
47.82%
 William H. White
11,400
39.20%
 Ephraim L. Acker(I)
3,776
12.98%
Oct 11, 1870 General Election
 Ephraim L. Acker
12,049
52.11%
 John A. Oliver
11,072
47.89%
Oct 13, 1868 General Election
 John D. Stiles
15,247
54.82%
 John R. Breitenbach
12,568
45.18%
Oct 09, 1866 General Election
 Benjamin M. Boyer(I)
14,009
55.03%
 David Thomas
11,447
44.97%
Oct 10, 1864 General Election
 Benjamin M. Boyer
12,847
57.08%
 George Bullock
9,661
42.92%
Oct 14, 1862 General Election
 John D. Stiles(I)
11,316
58.31%
 David Krause
8,092
41.69%
Date Type Results
Oct 09, 1860 General Election
 John Hickman(I)
10,140
55.97%
 John H. Brinton
7,701
42.51%
 Frazier Smith
275
1.52%
Oct 12, 1858 General Election
 John Hickman(I)
6,786
40.76%
 Charles D. Manly
5,185
31.15%
 John M. Broomall
4,676
28.09%
Oct 14, 1856 General Election
 John Hickman(I)
8,024
48.91%
 John S. Bowen
7,851
47.85%
 John Larkin
532
3.24%
Oct 10, 1854 General Election
 John Hickman
8,733
58.97%
 John M. Broomall
6,077
41.03%
Oct 12, 1852 General Election
 William Everhart
7,635
54.21%
 Andrew Murphy
6,449
45.79%
Date Type Results
Oct 08, 1850 General Election
 Thomas Ross
7,568
50.81%
 Caleb N. Taylor
7,328
49.19%
Oct 10, 1848 General Election
 Thomas Ross
8,043
51.02%
 Caleb N. Taylor
7,722
48.98%
Feb 23, 1848 Special Election
 Samuel A. Bridges
6,527
50.52%
 Lester Trexler
6,393
49.48%
Oct 13, 1846 General Election
 John W. Hornbeck
4,586
52.60%
 Jacob Erdman(I)
4,133
47.40%
Date Type Results
Oct 08, 1844 General Election
 Jacob Erdman
7,621
51.10%
 Michael H. Jenks(I)
7,293
48.90%
Oct 10, 1843 General Election
 Michael H. Jenks
5,755
53.01%
 John Davis
5,101
46.99%
Date Type Results
Oct 13, 1840 General Election
 Robert Ramsey
4,411
50.12%
 John Davis(I)
4,389
49.88%
Date Type Results
Oct 09, 1838 General Election
 John Davis
4,465
51.90%
 Mathias Morris(I)
4,138
48.10%
Oct 11, 1836 General Election
 Mathias Morris(I)
3,260
51.38%
 John Rockman
3,085
48.62%
Oct 14, 1834 General Election
 Mathias Morris
3,341
52.36%
 Henry Chapman
3,040
47.64%
Oct 09, 1832 General Election
 Robert Ramsey
2,682
43.92%
 Mathias Morris
2,355
38.56%
 Thomas Ross
1,070
17.52%
Date Type Results
Oct 12, 1830 General Election
 John C. Bucher
2,777
54.36%
 Valentine Hummel
2,332
45.64%
Oct 14, 1828 General Election
 Innis Green(I)
3,129
63.21%
 Valentine Hummel
1,821
36.79%
Oct 10, 1826 General Election
 Innis Green
1,995
62.17%
 John M. Forster
1,214
37.83%
Oct 12, 1824 General Election
 Robert Harris(I)
2,790
62.00%
 Christian Gleim
1,710
38.00%
Oct 08, 1822 General Election
 Robert Harris
2,476
54.62%
 John Phillips(I)
2,057
45.38%
Date Type Results
Oct 01, 1822 Special Election
 Samuel D. Ingham
6,131
60.51%
 Samuel Sitgreaves
4,002
39.49%
Oct 10, 1820 General Election
 Samuel Moore(I)
7,418
30.71%
 Thomas J. Rogers(I)
6,904
28.58%
 Daniel W. Dingman
5,092
21.08%
 Mathias Morris
4,739
19.62%
Oct 13, 1818 General Election
 Samuel Moore(I)
4,577
50.64%
 Thomas J. Rogers(I)
4,461
49.36%
Oct 13, 1818 Special Election
 Samuel Moore
3,936
100.00%
Mar 03, 1818 Special Election
 Thomas J. Rogers
2,926
93.01%
 Samuel Sitgreaves
220
6.99%
Oct 08, 1816 General Election
 John Ross(I)
5,511
50.79%
 Samuel D. Ingham(I)
5,339
49.21%
Oct 11, 1814 General Election
 Samuel D. Ingham(I)
5,889
34.12%
 John Ross
5,186
30.05%
 William Rodman
2,748
15.92%
 James Hollingshead
2,152
12.47%
 James Ralston
745
4.32%
 Samuel Sitgreaves
538
3.12%
Oct 13, 1812 General Election
 Robert Brown(I)
5,949
30.45%
 Samuel D. Ingham
5,938
30.40%
 William Rodman
3,744
19.17%
 William Lattimore
3,575
18.30%
 Samuel Sitgreaves
328
1.68%
Date Type Results
Oct 09, 1810 General Election
 William Crawford(I)
2,332
56.57%
 David Cassat
1,790
43.43%
Oct 11, 1808 General Election
 William Crawford
3,506
52.38%
 James Kelly(I)
3,188
47.62%
Oct 14, 1806 General Election
 James Kelly(I)
2,979
100.00%
Oct 09, 1804 General Election
 James Kelly
1,705
58.47%
 John Stewart(I)
1,211
41.53%
Oct 12, 1802 General Election
 John Stewart(I)
2,285
56.66%
 John Eddie
1,748
43.34%
Date Type Results
Oct 14, 1800 General Election
 John A. Hanna(I)
4,295
74.63%
 Samuel Maclay
1,460
25.37%
Oct 09, 1798 General Election
 John A. Hanna(I)
3,052
66.26%
 Daniel Smith
1,554
33.74%
Oct 11, 1796 General Election
 John A. Hanna
898
74.28%
 John Carson
255
21.09%
 Samuel Maclay(I)
56
4.63%
Oct 14, 1794 General Election
 Samuel Maclay
1,882
46.56%
 John A. Hanna
1,722
42.60%
 John Carson
438
10.84%
Date Type Results
Oct 11, 1791 General Election
 Andrew Gregg
3,437
51.23%
 John Allison
1,229
18.32%
 James McLean
728
10.85%
 Thomas Johnston
692
10.31%
 William Montgomery
623
9.29%

DISCUSSION
[Download as CSV]