Home About Chat Users Issues Party Candidates Polling Firms Media News Polls Calendar Key Races United States President Senate House Governors International

New User Account
"A comprehensive, collaborative elections resource." 
Email: Password:

  OH - District 09 - History
House of Representatives DETAILS
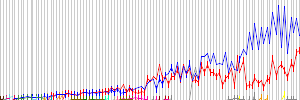
Parents > United States > Ohio > OH - District 09   Raw Vote Total:

Percentages:

Website
Established January 03, 1823
Disbanded Still Active
Last ModifiedRP April 28, 2011 11:19pm
Description

RACES [Show Primaries]
Redistricting: Light Green=Added Territory, Red=Removed Territory,
Dark Green=Kept Territory
Date Type Results
Nov 05, 2024 General Election
 Marcy Kaptur(I)
181,098
48.27%
 Derek Merrin
178,716
47.63%
 Tom Pruss
15,381
4.10%
Nov 08, 2022 General Election
 Marcy Kaptur(I)
150,655
56.63%
 James Richard "J.R." Majewski
115,362
43.37%
Date Type Results
Nov 03, 2020 General Election
 Marcy Kaptur(I)
190,328
63.07%
 Rob Weber
111,385
36.91%
 McKenzie Levindofske (W)
39
0.01%
Nov 06, 2018 General Election
 Marcy Kaptur(I)
157,219
67.79%
 Steven W. Kraus
74,670
32.19%
 McKenzie Levindofske (W)
48
0.02%
Nov 08, 2016 General Election
 Marcy Kaptur(I)
193,966
68.69%
 Donald Philip Larson
88,427
31.31%
 George A. Skalsky (W)
5
0.00%
Nov 04, 2014 General Election
 Marcy Kaptur(I)
108,870
67.74%
 Richard May
51,704
32.17%
 Cory Hoffman (W)
112
0.07%
 George A. Skalsky (W)
29
0.02%
Nov 06, 2012 General Election
 Marcy Kaptur(I)
217,771
73.04%
 Samuel "Joe the Plumber" Wurzelbacher
68,668
23.03%
 Sean Stipe
11,725
3.93%
Date Type Results
Nov 02, 2010 General Election
 Marcy Kaptur(I)
121,819
59.35%
 Rich Iott
83,423
40.65%
Nov 04, 2008 General Election
 Marcy Kaptur(I)
222,054
74.37%
 Bradley Leavitt
76,512
25.63%
Nov 07, 2006 General Election
 Marcy Kaptur(I)
153,880
73.63%
 Bradley Leavitt
55,119
26.37%
Nov 02, 2004 General Election
 Marcy Kaptur(I)
205,149
68.13%
 Larry Kaczala
95,983
31.87%
Nov 05, 2002 General Election
 Marcy Kaptur(I)
132,236
73.99%
 Edward S. Emery
46,481
26.01%
Date Type Results
Nov 07, 2000 General Election
 Marcy Kaptur(I)
168,547
74.80%
 Dwight E. Bryan
49,446
21.94%
 Galen Fries
4,239
1.88%
 Dennis Slotnick
3,096
1.37%
Nov 03, 1998 General Election
 Marcy Kaptur(I)
130,973
81.21%
 Edward S. Emery
30,312
18.79%
Nov 05, 1996 General Election
 Marcy Kaptur(I)
170,617
77.09%
 Randy Whitman
46,040
20.80%
 Elizabeth A. Slotnick
4,677
2.11%
Nov 08, 1994 General Election
 Marcy Kaptur(I)
118,120
75.34%
 Randy Whitman
38,665
24.66%
Nov 03, 1992 General Election
 Marcy Kaptur(I)
178,879
73.58%
 Ken D. Brown
53,011
21.81%
 Edward Howard
11,162
4.59%
  Others (W)
50
0.02%
Date Type Results
Nov 06, 1990 General Election
 Marcy Kaptur(I)
117,681
77.69%
 Jerry D. Lammers
33,791
22.31%
Nov 08, 1988 General Election
 Marcy Kaptur(I)
157,557
81.29%
 Al Hawkins
36,183
18.67%
  Others
72
0.04%
Nov 04, 1986 General Election
 Marcy Kaptur(I)
105,646
77.52%
 Mike Shufeldt
30,643
22.48%
Date Type Results
Nov 06, 1984 General Election
 Marcy Kaptur(I)
117,985
54.90%
 Frank C. Venner, III
93,210
43.37%
 Michael R. Nunn
2,255
1.05%
 Elizabeth Lariscy
1,459
0.68%
Nov 02, 1982 General Election
 Marcy Kaptur
95,162
57.95%
 Ed Weber(I)
64,459
39.25%
 Susan Skinner
1,785
1.09%
 James J. Somers
1,594
0.97%
 David Muir
1,217
0.74%
Date Type Results
Nov 04, 1980 General Election
 Ed Weber
95,927
55.96%
 Thomas W.L. Ashley(I)
68,728
40.09%
 Edward S. Emery
4,357
2.54%
 Toby E. Emmerich
2,411
1.41%
Nov 07, 1978 General Election
 Thomas W.L. Ashley(I)
71,709
63.39%
 John C. Hoyt
34,326
30.34%
 Michael J. Lewinski
4,530
4.00%
 Edward S. Emery
2,563
2.27%
Nov 02, 1976 General Election
 Thomas W.L. Ashley(I)
91,040
54.20%
 Carleton S. "Carty" Finkbeiner
73,919
44.01%
 Edward S. Emery
1,533
0.91%
 Lynn Galonsky
1,477
0.88%
Nov 05, 1974 General Election
 Thomas W.L. Ashley(I)
64,831
52.80%
 Carleton S. "Carty" Finkbeiner
57,892
47.15%
 Edward S. Emery (W)
52
0.04%
Nov 07, 1972 General Election
 Thomas W.L. Ashley(I)
110,450
69.10%
 Joseph C. Richards
49,388
30.90%
Date Type Results
Nov 03, 1970 General Election
 Thomas W.L. Ashley(I)
82,777
70.92%
 Allen H. Shapiro
33,947
29.08%
Nov 05, 1968 General Election
 Thomas W.L. Ashley(I)
85,280
57.40%
 Ben Marsh
63,290
42.60%
Date Type Results
Nov 08, 1966 General Election
 Thomas W.L. Ashley(I)
83,261
60.76%
 Jane Kuebbeler
53,777
39.24%
Date Type Results
Nov 03, 1964 General Election
 Thomas W.L. Ashley(I)
109,167
62.90%
 John O. Celusta
64,401
37.10%
Nov 06, 1962 General Election
 Thomas W.L. Ashley(I)
86,443
57.35%
 Martin A. Janis
64,279
42.65%
Nov 08, 1960 General Election
 Thomas W.L. Ashley(I)
108,688
56.87%
 Howard C. Cook
82,433
43.13%
Nov 04, 1958 General Election
 Thomas W.L. Ashley(I)
102,115
61.60%
 William K. Gernheuser
63,660
38.40%
Nov 06, 1956 General Election
 Thomas W.L. Ashley(I)
100,696
55.25%
 Harvey G. Straub
81,562
44.75%
Nov 02, 1954 General Election
 Thomas W.L. Ashley
48,471
36.43%
 Henry Frazier Reams, Sr.(I)
44,656
33.56%
 Irving C. Reynolds
39,933
30.01%
Nov 04, 1952 General Election
 Henry Frazier Reams, Sr.(I)
74,821
40.92%
 Thomas Henry Burke
61,047
33.39%
 A. Gilmore Flues
46,989
25.70%
Date Type Results
Nov 07, 1950 General Election
 Henry Frazier Reams, Sr.
51,024
36.55%
 Thomas Henry Burke(I)
45,268
32.43%
 Homer Alonzo Ramey
43,301
31.02%
Nov 02, 1948 General Election
 Thomas Henry Burke
85,409
53.78%
 Homer Alonzo Ramey(I)
73,394
46.22%
Nov 05, 1946 General Election
 Homer Alonzo Ramey(I)
59,394
50.14%
 Michael V. DiSalle
59,057
49.86%
Nov 07, 1944 General Election
 Homer Alonzo Ramey(I)
82,735
51.57%
 John F. Hunter
77,693
48.43%
Nov 03, 1942 General Election
 Homer Alonzo Ramey
47,377
51.83%
 John F. Hunter(I)
44,027
48.17%
Nov 05, 1940 General Election
 John F. Hunter(I)
86,956
54.73%
 Wilbur M. White
71,927
45.27%
Nov 08, 1938 General Election
 John F. Hunter(I)
56,306
50.39%
 Homer Alonzo Ramey
55,441
49.61%
Nov 03, 1936 General Election
 John F. Hunter
75,737
56.30%
 Raymond E. Hildebrand
55,043
40.92%
 Earl O. Lehman
3,739
2.78%
Nov 06, 1934 General Election
 Warren Joseph Duffey(I)
61,037
62.31%
 Frank L. Mulholland
35,732
36.47%
 Kenneth Eggert
684
0.70%
 Karl Pauli
510
0.52%
Nov 08, 1932 General Election
 Warren Joseph Duffey
56,755
47.65%
 Wilbur M. White(I)
54,078
45.40%
 Silas E. Hurin
4,200
3.53%
 Clyde E. Kiker
2,135
1.79%
 Karl Pauli
1,314
1.10%
 Eugene Stoll
620
0.52%
Nov 04, 1930 General Election
 Wilbur M. White
49,498
57.64%
 Scott Stahl
36,375
42.36%
Nov 06, 1928 General Election
 William Wallace "W.W." Chalmers(I)
82,560
61.91%
 William P. Clarke
50,601
37.95%
 Charles V. Stephenson
190
0.14%
Nov 02, 1926 General Election
 William Wallace "W.W." Chalmers(I)
47,331
64.48%
 C. W. Davis
23,947
32.62%
 George F. Parrish
1,110
1.51%
 Millard Price
1,018
1.39%
Nov 04, 1924 General Election
 William Wallace "W.W." Chalmers
54,792
51.60%
 Isaac R. Sherwood(I)
48,482
45.66%
 Millard Price
2,159
2.03%
 John Kocinski
747
0.70%
Nov 07, 1922 General Election
 Isaac R. Sherwood
45,059
51.34%
 William Wallace "W.W." Chalmers(I)
42,712
48.66%
Nov 02, 1920 General Election
 William Wallace "W.W." Chalmers
49,732
56.47%
 Isaac R. Sherwood(I)
38,292
43.48%
 Karl Pauli
47
0.05%
Nov 05, 1918 General Election
 Isaac R. Sherwood(I)
25,122
55.09%
 James M. Ashley
18,398
40.34%
 Solon T. Klotz
2,085
4.57%
Nov 07, 1916 General Election
 Isaac R. Sherwood(I)
31,921
58.15%
 Frank L. Mulholland
19,882
36.22%
 Thomas C. Devine
3,091
5.63%
Nov 03, 1914 General Election
 Isaac R. Sherwood(I)
29,399
53.75%
 William E. Cordill
16,152
29.53%
 Herbert P. Whitney
5,949
10.88%
 Edward Hoskins
3,200
5.85%
Date Type Results
Nov 05, 1912 General Election
 Isaac R. Sherwood(I)
26,528
53.28%
 Holland C. Webster
17,490
35.13%
 Thomas C. Devine
5,769
11.59%
Nov 08, 1910 General Election
 Isaac R. Sherwood(I)
21,908
48.03%
 J. Kent Hamilton
19,593
42.96%
 W. F. Ries
3,917
8.59%
 M. A. Gibson
191
0.42%
Nov 03, 1908 General Election
 Isaac R. Sherwood(I)
29,851
48.91%
 James H. Southard
27,523
45.09%
 Charles H. Miller
3,285
5.38%
 J. T. Braithwaite
377
0.62%
Nov 06, 1906 General Election
 Isaac R. Sherwood
18,411
47.79%
 E. G. McClelland
18,370
47.68%
 Walter C. Guntrup
1,350
3.50%
 Ellis H. Borton
394
1.02%
Nov 08, 1904 General Election
 James H. Southard(I)
35,128
63.73%
 William H. Althof
16,488
29.91%
 Walter C. Guntrup
2,445
4.44%
 Aaron S. Watkins
1,058
1.92%
Nov 04, 1902 General Election
 James H. Southard(I)
23,815
56.60%
 Charles I. York
15,873
37.72%
 James S. Pyle
1,817
4.32%
 Harry McLane
572
1.36%
Date Type Results
Nov 06, 1900 General Election
 James H. Southard(I)
29,544
51.58%
 Negley D. Cochran
26,697
46.61%
 Byron A. Case
1,037
1.81%
Nov 08, 1898 General Election
 James H. Southard(I)
21,913
54.77%
 Samuel E. Niece
18,081
45.19%
 David Miley
16
0.04%
Nov 03, 1896 General Election
 James H. Southard(I)
29,603
53.53%
 Stephen Brophy
25,698
46.47%
Nov 06, 1894 General Election
 James H. Southard
20,715
54.82%
 Byron F. Ritchie(I)
14,109
37.34%
 George Candee
2,964
7.84%
Nov 08, 1892 General Election
 Byron F. Ritchie
20,041
48.04%
 James M. Ashley
20,027
48.00%
 William G. Leet
1,103
2.64%
 William Dunnipace
548
1.31%
Date Type Results
Nov 04, 1890 General Election
 Joseph H. Outhwaite(I)
18,550
51.78%
 Thomas B. Wilson
16,418
45.82%
 Albert Dunlap
860
2.40%
Date Type Results
Nov 06, 1888 General Election
 William C. Cooper(I)
19,491
50.72%
 John S. Braddock
17,267
44.93%
 Joseph McFarland
1,646
4.28%
 Abram Conklin
26
0.07%
Nov 02, 1886 General Election
 William C. Cooper(I)
17,659
49.83%
 John C. Levering
15,790
44.56%
 William H. Elsom
1,900
5.36%
 John J. Scribner
77
0.22%
 Charles Davidson
12
0.03%
Date Type Results
Oct 14, 1884 General Election
 William C. Cooper
18,415
51.12%
 Earley E. Poppleton
16,634
46.18%
 J. W. Sharp
930
2.58%
 Lewis Graham
42
0.12%
Date Type Results
Oct 10, 1882 General Election
 James S. Robinson(I)
15,864
48.75%
 Thomas E. Powell
15,458
47.51%
 William Bonar
1,217
3.74%
Date Type Results
Oct 12, 1880 General Election
 James S. Robinson
18,146
51.00%
 Caleb H. Norris
17,007
47.80%
 J. A. Mouser
425
1.19%
Date Type Results
Oct 08, 1878 General Election
 George L. Converse
17,786
48.91%
 Lorenzo English
16,798
46.19%
 Christopher Lewis
1,275
3.51%
 James H. Coulter
508
1.40%
Date Type Results
Oct 10, 1876 General Election
 John S. Jones
15,968
50.71%
 Earley E. Poppleton(I)
15,175
48.19%
 Levi L. Benson
344
1.09%
Oct 13, 1874 General Election
 Earley E. Poppleton
11,627
48.71%
 James W. Robinson(I)
11,199
46.91%
 Mills Harrod
1,045
4.38%
Oct 08, 1872 General Election
 James W. Robinson
13,573
50.37%
 George W. Morgan(I)
13,146
48.78%
 C. W. Townsend
229
0.85%
Date Type Results
Oct 11, 1870 General Election
 Charles Foster
13,274
51.21%
 Edward F. Dickinson(I)
12,498
48.21%
  Brooks
151
0.58%
Oct 13, 1868 General Election
 Edward F. Dickinson
16,322
52.65%
 William H. Gibson
14,677
47.35%
Oct 09, 1866 General Election
 Ralph P. Buckland(I)
15,231
52.21%
 Thomas P. Finefrock
13,944
47.79%
Oct 10, 1864 General Election
 Ralph P. Buckland
13,626
53.83%
 Warren P. Noble(I)
11,688
46.17%
Oct 14, 1862 General Election
 Warren P. Noble(I)
11,765
52.79%
 Samuel T. Worcester(I)
10,523
47.21%
Date Type Results
Oct 09, 1860 General Election
 Warren P. Noble
12,650
51.12%
 John Carey(I)
12,096
48.88%
Oct 12, 1858 General Election
 John Carey
9,304
50.29%
 Lawrence W. Hall(I)
9,197
49.71%
Oct 14, 1856 General Election
 Lawrence W. Hall
9,561
49.76%
 Cooper K. Watson(I)
9,382
48.83%
 William Wilson
271
1.41%
Oct 10, 1854 General Election
 Cooper K. Watson
8,399
59.92%
 Josiah S. Plants
5,618
40.08%
Oct 12, 1852 General Election
 Frederick W. Green(I)
8,198
74.12%
 James H. Goodman
2,095
18.94%
 George W. Sampson
768
6.94%
Date Type Results
Oct 08, 1850 General Election
 Edson B. Olds(I)
6,283
50.70%
 Philadelph Van Trump
6,110
49.30%
Oct 10, 1848 General Election
 Edson B. Olds
6,984
50.28%
 Thomas O. Edwards(I)
6,906
49.72%
Oct 13, 1846 General Election
 Thomas O. Edwards
6,030
50.76%
 Augustus L. Perrill(I)
5,779
48.65%
 Lester Burnham
70
0.59%
Date Type Results
Oct 08, 1844 General Election
 Augustus L. Perrill
6,475
52.55%
 Elias Florence(I)
5,797
47.05%
 William Edwards
50
0.41%
Oct 10, 1843 General Election
 Elias Florence
5,429
52.74%
 William Medill(I)
4,864
47.26%
Date Type Results
Oct 13, 1840 General Election
 William Medill(I)
8,218
57.14%
 George Sanderson
6,163
42.86%
Oct 09, 1838 General Election
 William Medill
6,791
64.55%
 John M. Creed
3,729
35.45%
Oct 11, 1836 General Election
 John Chaney(I)
5,838
60.67%
 Henry Stanberry
3,784
39.33%
Oct 14, 1834 General Election
 John Chaney(I)
4,447
58.47%
 William W. Irvin
3,158
41.53%
Oct 09, 1832 General Election
 John Chaney
4,235
53.99%
 William W. Irvin(I)
3,609
46.01%
Date Type Results
Oct 12, 1830 General Election
 William W. Irvin(I)
7,919
100.00%
Date Type Results
Oct 14, 1828 General Election
 William W. Irvin
4,903
56.00%
 Philemon Beecher(I)
3,853
44.00%
Oct 10, 1826 General Election
 Philemon Beecher(I)
3,739
54.99%
 John Mathews
2,325
34.20%
 Robert McConnell
735
10.81%
Oct 12, 1824 General Election
 Philemon Beecher(I)
2,668
40.15%
 David Chambers
2,202
33.14%
 William Irwin
1,290
19.41%
 Robert McConnell
485
7.30%
Oct 08, 1822 General Election
 Philemon Beecher
1,996
37.59%
 David Chambers(I)
1,820
34.27%
 Samuel Sullivan
956
18.00%
 William Trimble
538
10.13%

DISCUSSION
[Download as CSV]