|
|
"A comprehensive, collaborative elections resource."
|
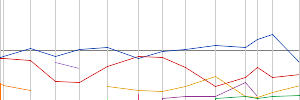
Norfolk North West - History
 | Parliament DETAILS |
|
|
| Parents |
> United Kingdom > England > East of England > East of England > Norfolk North West
|
|
Raw Vote Total:

Percentages:

|
| Website | |
| Established | February 28, 1974 |
| Disbanded | Still Active |
| Last Modified | RBH September 11, 2021 03:12pm |
| Description | This constituency is a mixed bag, containing the port of King's Lynn, many small farming communities, some light industry, and the royal family's Norfolk retreat, the Sandringham Estate. King's Lynn is an industrial town with an affluent past - it was once England's third port and boasts two medieval guildhalls, two magnificent market places and 12th Century St Margaret's Church. It tends towards Labour, and is usually counterbalanced elsewhere in the constituency. That balance is provided by the agricultural villages of west Norfolk, where cereals and sugar-beet are the crops of choice in this part of the Fens. The rural vote is significant in this seat, since King's Lynn only makes up a minority of the constituency's electorate. The seat was for a long time one of the last bastions of a now all-but-dead demographic, the rural Labour supporter, and this tradition helped Labour in 1997 to one of the most surprising of their many remarkable victories. However, the ousted MP Henry Bellingham stood again and managed to reclaim the seat in 2001 on a decent swing.
[Link] |
|
Redistricting: Light Green=Added Territory, Red=Removed Territory, Dark Green=Kept Territory
| |
| No Map In System
|
| Date |
Type |
Results |
| Dec 12, 2019 |
General Election |
|
| Jun 08, 2017 |
General Election |
|
| May 07, 2015 |
General Election |
|
| May 06, 2010 |
General Election |
|
| May 05, 2005 |
General Election |
|
| Jun 07, 2001 |
General Election |
|
| May 01, 1997 |
General Election |
|
| Apr 09, 1992 |
General Election |
|
| Jun 11, 1987 |
General Election |
|
| Jun 09, 1983 |
General Election |
|
| May 03, 1979 |
General Election |
|
| Oct 10, 1974 |
General Election |
|
| Feb 28, 1974 |
General Election |
|
|
|
[Download as CSV]
|

