Home About Chat Users Issues Party Candidates Polling Firms Media News Polls Calendar Key Races United States President Senate House Governors International

New User Account
"A comprehensive, collaborative elections resource." 
Email: Password:

  Birmingham Ladywood - History
Parliament DETAILS
Parents > United Kingdom > England > West Midlands > West Midlands > Birmingham Ladywood   Raw Vote Total:

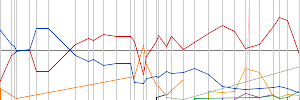
Percentages:

Website
Established December 14, 1918
Disbanded Still Active
Last ModifiedNew Jerusalem April 12, 2010 05:56am
DescriptionUntil 1974, Birmingham Ladywood covered a small area immediately north and west of the city centre. The constituency had one of the largest concentrations of slum housing in Britain and its electorate shrank at a rapid rate after slum clearance began in the late 1950s.

In 1974, the now tiny Ladywood constituency was merged into the far larger All Saints constituency. The name Ladywood was retained for this new constituency, in part because of the historical importance of the constituency name. Later boundary changes have meant that Birmingham Ladywood now covers almost all of central Birmingham, including Aston, Nechells and Digbeth.

RACES [Show Primaries]
Redistricting: Light Green=Added Territory, Red=Removed Territory,
Dark Green=Kept Territory
Date Type Results
Jul 04, 2024 General Election
 Shabana Mahmood(I)
15,558
42.53%
 Akhmed Yakoob
12,137
33.18%
 Zoe Challenor
3,478
9.51%
 Shaz Muzammil
2,218
6.06%
 Lee Dargue
1,711
4.68%
 Irene Yoong-Henery
1,477
4.04%
Date Type Results
Dec 12, 2019 General Election
 Shabana Mahmood(I)
33,355
79.19%
 Mary Noone
4,773
11.33%
 Lee Dargue
2,228
5.29%
 Alex Nettle
931
2.21%
 Andrew Garcarz
831
1.97%
Jun 08, 2017 General Election
 Shabana Mahmood(I)
34,166
82.69%
 Andrew Browning
5,462
13.22%
 Lee Dargue
1,156
2.80%
 Kefentse Dennis
533
1.29%
May 07, 2015 General Election
 Shabana Mahmood(I)
26,444
73.63%
 Isabel Sigmac
4,576
12.74%
 Clair Braund
1,805
5.03%
 Margaret Okole
1,501
4.18%
 Shazad Iqbal
1,374
3.83%
 Timothy Burton
216
0.60%
May 06, 2010 General Election
 Shabana Mahmood
19,950
55.67%
 Ayoub Khan
9,845
27.47%
 Nusrat Ghani
4,277
11.94%
 Christopher Booth
902
2.52%
 Peter Beck
859
2.40%
No Map In System
Date Type Results
Oct 20, 2006 Party Switch
 Clare Short(I)
1
100.00%
May 05, 2005 General Election
 Clare Short(I)
17,262
51.92%
 Ayoub Khan
10,461
31.47%
 Philippa Stroud
3,515
10.57%
 Lyn Nazemi-Afshar
2,008
6.04%
Jun 07, 2001 General Election
 Clare Short(I)
21,694
68.89%
 Benjamin Prentice
3,551
11.28%
 Mahmood Chaudhry
2,586
8.21%
 Allah Ditta
2,112
6.71%
 Surinder Virdee
443
1.41%
 Mahmood Hussain
432
1.37%
 James Caffery
392
1.24%
  Anneliese Nattrass
283
0.90%
May 01, 1997 General Election
 Clare Short(I)
28,134
74.08%
 Shailesh Vara
5,052
13.30%
 S.S. Marwa
3,020
7.95%
 Ruth A. Gurney
1,086
2.86%
 Andrew Carmichael
685
1.80%
Apr 09, 1992 General Election
 Clare Short(I)
24,887
66.26%
 Barbara S. Ashford
9,604
25.57%
 Brian L. Worth
3,068
8.17%
Jun 11, 1987 General Election
 Clare Short(I)
21,971
57.67%
 Simon Lee
11,943
31.35%
 Gurdial Singh Sangha
3,532
9.27%
 Joyce Millington
650
1.71%
Jun 09, 1983 General Election
 Clare Short
19,278
50.95%
 Pramilla Le Hunte
10,248
27.08%
 Ken Hardeman
7,758
20.50%
 Baba Bakhtaura
355
0.94%
 Rodney W. Atkinson
198
0.52%
May 03, 1979 General Election
 John Sever(I)
13,450
63.53%
 A. Newhouse
5,691
26.88%
 Ken Hardeman
2,030
9.59%
Aug 18, 1977 By-election
 John Sever
8,227
53.66%
 Quentin Davies
4,402
28.71%
 Anthony Reed Herbert
888
5.79%
 Ken Hardeman
765
4.99%
 Raghib Ahsan
534
3.48%
 James Hunte
336
2.19%
 George Matthews
71
0.46%
  Peter B. Courtney
63
0.41%
 William "Bill" Boaks
46
0.30%
Oct 10, 1974 General Election
 Brian Walden(I)
14,818
64.47%
 Richard Lawn
5,079
22.10%
 Ken Hardeman
3,086
13.43%
Feb 28, 1974 General Election
 Brian Walden(I)
15,126
58.64%
 Richard Lawn
6,164
23.90%
 Ken Hardeman
3,753
14.55%
 John A. A. Davis
751
2.91%
Jun 18, 1970 General Election
 Doris Fisher
5,067
43.39%
 Wallace Lawler(I)
4,087
35.00%
 Charles Lawrence Wade
2,523
21.61%
Jun 26, 1969 By-election
 Wallace Lawler
5,104
54.35%
 Doris Fisher
2,391
25.46%
 Louis Glass
1,580
16.82%
 Colin Jordan
282
3.00%
 James Haigh
34
0.36%
Mar 31, 1966 General Election
 Victor Yates(I)
8,895
58.92%
 Wallace Lawler
3,580
23.71%
 Thomas G. John
2,621
17.36%
Oct 15, 1964 General Election
 Victor Yates(I)
10,098
63.20%
 Thomas G. John
5,879
36.80%
Oct 08, 1959 General Election
 Victor Yates(I)
14,717
63.68%
 Thomas G. John
8,393
36.32%
May 26, 1955 General Election
 Victor Yates(I)
18,476
65.66%
 Peter W. Hodgens
9,665
34.34%
Oct 25, 1951 General Election
 Victor Yates(I)
24,088
59.60%
 Leslie Seymour
16,331
40.40%
Feb 23, 1950 General Election
 Victor Yates(I)
25,603
61.44%
 Frederic Bennett
16,071
38.56%
Jul 05, 1945 General Election
 Victor Yates
13,503
55.89%
 Geoffrey Lloyd(I)
10,657
44.11%
Nov 14, 1935 General Election
 Geoffrey Lloyd(I)
18,565
71.75%
 Hubert Humphreys
7,311
28.25%
Oct 27, 1931 General Election
 Geoffrey Lloyd
23,057
71.80%
 Wilfrid Whiteley(I)
9,057
28.20%
May 30, 1929 General Election
 Wilfrid Whiteley
16,447
50.02%
 Geoffrey Lloyd
16,436
49.98%
Oct 29, 1924 General Election
 Neville Chamberlain(I)
13,374
49.15%
 Oswald Mosley
13,297
48.87%
 Alfred William Bowkett
539
1.98%
Dec 06, 1923 General Election
 Neville Chamberlain(I)
12,884
53.21%
 Robert Dunstan
11,330
46.79%
Nov 15, 1922 General Election
 Neville Chamberlain(I)
13,032
55.17%
 Robert Dunstan
10,589
44.83%
Dec 14, 1918 General Election
 Neville Chamberlain
9,405
69.52%
 John W. Kneeshaw
2,572
19.01%
 Margery Corbett Ashby
1,552
11.47%

DISCUSSION
[Download as CSV]