Home About Chat Users Issues Party Candidates Polling Firms Media News Polls Calendar Key Races United States President Senate House Governors International

New User Account
"A comprehensive, collaborative elections resource." 
Email: Password:

  MI - District 12 - History
House of Representatives DETAILS
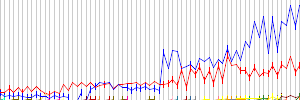
Parents > United States > Michigan > MI - District 12   Raw Vote Total:

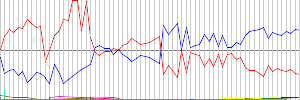
Percentages:

Website
Established January 03, 1893
Disbanded Still Active
Last ModifiedRP January 07, 2022 08:35am
Description

RACES [Show Primaries]
Redistricting: Light Green=Added Territory, Red=Removed Territory,
Dark Green=Kept Territory
Date Type Results
Nov 05, 2024 General Election
 Rashida H. Tlaib(I)
253,354
69.70%
 James Hooper
92,490
25.44%
 Gary Walkowicz
9,401
2.59%
 Brenda K. Sanders
8,254
2.27%
 Steven Elliott (W)
0
0.00%
Nov 08, 2022 General Election
 Rashida H. Tlaib(I)
196,643
70.84%
 Steven Elliott
72,888
26.26%
 Gary Walkowicz
8,046
2.90%
Date Type Results
Nov 03, 2020 General Election
 Debbie Dingell(I)
254,957
66.43%
 Jeff Jones
117,719
30.67%
 Gary Walkowicz
11,147
2.90%
Nov 06, 2018 General Election
 Debbie Dingell(I)
200,588
68.08%
 Jeff Jones
85,115
28.89%
 Gary Walkowicz
6,712
2.28%
 Niles Niemuth
2,213
0.75%
Nov 08, 2016 General Election
 Debbie Dingell(I)
211,378
64.34%
 Jeff Jones
96,104
29.25%
 Gary Walkowicz
9,183
2.80%
 Tom Bagwell
7,489
2.28%
 Dylan Calewarts
4,377
1.33%
 Ejaz Virk (W)
11
0.00%
Nov 04, 2014 General Election
 Debbie Dingell
134,346
65.01%
 Terry Bowman
64,716
31.32%
 Gary Walkowicz
5,039
2.44%
 Bhagwan "Bob" Dashairya
2,559
1.24%
Nov 06, 2012 General Election
 John D. Dingell(I)
216,884
67.94%
 Cynthia J. Kallgren
92,472
28.97%
 Richard J. Secula
9,867
3.09%
Date Type Results
Nov 02, 2010 General Election
 Sander "Sandy" Levin(I)
124,671
61.08%
 Don Volaric
71,372
34.97%
 Julia Williams
3,038
1.49%
 Leonard Schwartz
2,342
1.15%
 Les Townsend
2,285
1.12%
 Alan Jacquemotte
409
0.20%
Nov 04, 2008 General Election
 Sander "Sandy" Levin(I)
225,094
72.07%
 Bert Copple
74,565
23.87%
 John Vico
4,767
1.53%
 Les Townsend
4,076
1.30%
 William J. Opalicky
3,842
1.23%
Nov 07, 2006 General Election
 Sander "Sandy" Levin(I)
168,494
70.17%
 Randell J. Shafer
62,689
26.11%
 Andy LeCureaux
3,259
1.36%
 Les Townsend
2,076
0.86%
 Jerome "Jerry" White
1,862
0.78%
 Art Myatt
1,735
0.72%
Nov 02, 2004 General Election
 Sander "Sandy" Levin(I)
210,827
69.32%
 Randell J. Shafer
88,256
29.02%
 Richard C. "Dick" Gach
5,051
1.66%
Nov 05, 2002 General Election
 Sander "Sandy" Levin(I)
140,970
68.26%
 Harvey Dean
61,502
29.78%
 Richard C. "Dick" Gach
2,694
1.30%
 Steven Revis
1,362
0.66%
Date Type Results
Nov 07, 2000 General Election
 Sander "Sandy" Levin(I)
157,720
64.33%
 Bart Baron
78,795
32.14%
 Thomas Ness
4,137
1.69%
 Andy LeCureaux
3,630
1.48%
 Fred E. Rosenberg
887
0.36%
Nov 03, 1998 General Election
 Sander "Sandy" Levin(I)
105,824
55.87%
 Leslie A. Touma
79,619
42.03%
 Albert J. Titran
2,813
1.48%
 Fred E. Rosenberg
1,172
0.62%
Nov 05, 1996 General Election
 Sander "Sandy" Levin(I)
133,436
57.40%
 John Pappageorge
94,235
40.54%
 Albert J. Titran
3,101
1.33%
 Gail Anne Petrosoff
1,690
0.73%
  Others (W)
13
0.01%
Nov 08, 1994 General Election
 Sander "Sandy" Levin(I)
103,508
52.01%
 John Pappageorge
92,762
46.61%
 Jerome "Jerry" White
1,386
0.70%
 Eric R. Anderson
1,340
0.67%
  Others
22
0.01%
Nov 03, 1992 General Election
 Sander "Sandy" Levin(I)
137,514
52.62%
 John Pappageorge
119,357
45.67%
 Charles Hahn
2,751
1.05%
 R. W. Montgomery
1,724
0.66%
  Others (W)
3
0.00%
Date Type Results
Nov 06, 1990 General Election
 David E. Bonior(I)
98,232
64.70%
 Jim Dingeman
51,119
33.67%
 Robert W. Roddis
2,472
1.63%
  Write-In (W)
2
0.00%
Nov 08, 1988 General Election
 David E. Bonior(I)
108,158
53.60%
 Douglas Carl
91,780
45.48%
 Keith P. Edwards
1,311
0.65%
 Vincent Mario Contrera
548
0.27%
Nov 04, 1986 General Election
 David E. Bonior(I)
87,643
66.35%
 Candice Miller
44,442
33.65%
Nov 06, 1984 General Election
 David E. Bonior(I)
113,172
58.22%
 Eugene J. Tyza
79,824
41.07%
 Keith P. Edwards
1,388
0.71%
Nov 02, 1982 General Election
 David E. Bonior(I)
103,851
65.87%
 Ray Contesti
52,312
33.18%
 Keith P. Edwards
1,501
0.95%
Date Type Results
Nov 04, 1980 General Election
 David E. Bonior(I)
112,698
55.34%
 Kirk Walsh
90,931
44.66%
Nov 07, 1978 General Election
 David E. Bonior(I)
82,892
54.91%
 Kirby Holmes
68,063
45.09%
  Others
1
0.00%
Nov 02, 1976 General Election
 David E. Bonior
94,815
52.42%
 David M. Serotkin
85,326
47.17%
 Gregory J. Clark
441
0.24%
 Marielle "Molly" Kronberg
285
0.16%
  Write-In (W)
10
0.01%
Nov 05, 1974 General Election
 James G. O'Hara(I)
89,822
72.20%
 Eugene J. Tyza
34,293
27.56%
 Richard Orawiec
297
0.24%
Nov 07, 1972 General Election
 James G. O'Hara(I)
83,351
50.82%
 David M. Serotkin
80,667
49.18%
Date Type Results
Nov 03, 1970 General Election
 James G. O'Hara(I)
129,287
76.14%
 Patrick Driscoll
38,946
22.94%
 Milton E. Deschaine
1,562
0.92%
Nov 05, 1968 General Election
 James G. O'Hara(I)
131,517
70.34%
 Max B. Harris, Jr.
54,760
29.29%
 Frank Lovell
391
0.21%
 James C. Horvath
299
0.16%
Nov 08, 1966 General Election
 James G. O'Hara(I)
84,379
65.12%
 Patrick Driscoll
45,199
34.88%
Nov 03, 1964 General Election
 James G. O'Hara(I)
126,769
74.84%
 Robert G. Powell
42,615
25.16%
Date Type Results
Nov 06, 1962 General Election
 John B. Bennett(I)
41,784
63.29%
 William J. Bolognesi
24,240
36.71%
Nov 08, 1960 General Election
 John B. Bennett(I)
48,422
60.83%
 Robert C. McCarthy
31,137
39.12%
 Halmer Dahlgren
41
0.05%
Nov 04, 1958 General Election
 John B. Bennett(I)
39,239
57.03%
 Joseph S. Mack
29,506
42.89%
 Harold A. Lindahl
54
0.08%
Nov 06, 1956 General Election
 John B. Bennett(I)
45,721
56.34%
 Joseph S. Mack
35,434
43.66%
Nov 02, 1954 General Election
 John B. Bennett(I)
39,531
55.90%
 Frank E. Hook
31,187
44.10%
Nov 04, 1952 General Election
 John B. Bennett(I)
47,160
58.18%
 E. Burr Sherwood
33,892
41.82%
Date Type Results
Nov 07, 1950 General Election
 John B. Bennett(I)
43,010
61.73%
 John Sabol
26,667
38.27%
Nov 02, 1948 General Election
 John B. Bennett(I)
42,955
56.59%
 Gene A. Saari
32,485
42.79%
 Olga Anderson
433
0.57%
 Arthur Juntunen
39
0.05%
Nov 05, 1946 General Election
 John B. Bennett
40,717
54.42%
 Frank E. Hook(I)
33,799
45.17%
 August Larson
309
0.41%
Nov 07, 1944 General Election
 Frank E. Hook
41,481
50.55%
 John B. Bennett(I)
40,573
49.45%
Nov 03, 1942 General Election
 John B. Bennett
31,643
51.52%
 Frank E. Hook(I)
27,983
45.56%
 Andrew Asikainen
1,795
2.92%
Nov 05, 1940 General Election
 Frank E. Hook(I)
47,429
51.28%
 John B. Bennett
44,733
48.36%
 Arvid N. Phillips
329
0.36%
Nov 08, 1938 General Election
 Frank E. Hook(I)
43,453
51.71%
 John B. Bennett
40,587
48.29%
Nov 03, 1936 General Election
 Frank E. Hook(I)
46,284
54.72%
 William Frank James
37,714
44.59%
 Raymond E. Garvey
581
0.69%
Nov 06, 1934 General Election
 Frank E. Hook
37,298
52.09%
 William Frank James(I)
34,281
47.88%
 Frank Arvola
18
0.03%
Nov 08, 1932 General Election
 William Frank James(I)
48,014
62.50%
 Levi S. Rice
26,925
35.05%
 Arne Roine
1,888
2.46%
Date Type Results
Nov 04, 1930 General Election
 William Frank James(I)
36,909
98.13%
 Edwin Mutila
703
1.87%
Nov 06, 1928 General Election
 William Frank James(I)
47,069
69.11%
 L. A. Barry
21,039
30.89%
Nov 02, 1926 General Election
 William Frank James(I)
37,117
100.00%
Nov 04, 1924 General Election
 William Frank James(I)
47,114
100.00%
Nov 07, 1922 General Election
 William Frank James(I)
26,228
79.45%
 Frederick Kappler
6,784
20.55%
Nov 02, 1920 General Election
 William Frank James(I)
41,783
80.38%
 Edward C. Anthony
8,446
16.25%
 Olga S. Von Zellen
1,753
3.37%
Nov 05, 1918 General Election
 William Frank James(I)
17,315
69.82%
 Albert S. Ley
6,681
26.94%
 John Kuskila
804
3.24%
Nov 07, 1916 General Election
 William Frank James(I)
22,998
64.10%
 William J. MacDonald
12,882
35.90%
Nov 03, 1914 General Election
 William Frank James
14,562
49.27%
 William J. MacDonald(I)
9,205
31.14%
 Frederic J. Bawden
4,962
16.79%
 Andrew E. Anderson
829
2.80%
Date Type Results
Nov 05, 1912 General Election
 William J. MacDonald
18,433
39.27%
 H. Olin Young(I)
18,190
38.75%
 John Powers
10,322
21.99%
Nov 05, 1912 Election Overturned
 H. Olin Young(I)
18,190
39.13%
 William J. MacDonald
17,975
38.67%
 John Powers
10,322
22.20%
Nov 08, 1910 General Election
 H. Olin Young(I)
24,661
73.61%
 Gideon T. Werline
8,751
26.12%
 Richard Quale
89
0.27%
Nov 03, 1908 General Election
 H. Olin Young(I)
35,310
72.21%
 Patrick H. O'Brien
13,586
27.79%
Nov 06, 1906 General Election
 H. Olin Young(I)
22,271
76.50%
 John F. Ryan
6,315
21.69%
 Frank Vivian
527
1.81%
Nov 08, 1904 General Election
 H. Olin Young(I)
36,655
80.31%
 John W. Block
7,915
17.34%
 Harvey B. Hatch
1,071
2.35%
Nov 04, 1902 General Election
 H. Olin Young
21,224
71.48%
 John Powers
8,467
28.52%
Nov 06, 1900 General Election
 Carlos D. Shelden(I)
33,759
72.69%
 Edward F. Legendre
11,516
24.80%
 Jacob Kaminen
1,167
2.51%
Nov 08, 1898 General Election
 Carlos D. Shelden(I)
19,895
67.12%
 Solomon S. Curry
8,921
30.10%
 Harvey B. Hatch
825
2.78%
Nov 03, 1896 General Election
 Carlos D. Shelden
29,612
70.35%
 Henry W. Seymour
12,479
29.65%
Nov 06, 1894 General Election
 Samuel M. Stephenson(I)
20,935
63.97%
 Rush Culver
8,714
26.63%
 Andrew E. Anderson
3,076
9.40%
Nov 08, 1892 General Election
 Samuel M. Stephenson(I)
20,097
50.69%
 J. Maurice Finn
16,674
42.06%
 Zina A. Clough
1,898
4.79%
 Gustave Deimel
926
2.34%
 John R. Ryan
49
0.12%

DISCUSSION
[Download as CSV]