|
|
"A comprehensive, collaborative elections resource."
|
Lambton—Kent—Middlesex - History
 | Parliament DETAILS |
|
|
| Parents |
> Canada > Ontario > ON House of Commons > Lambton—Kent—Middlesex
|
 |
Raw Vote Total:

Percentages:

|
| Website | |
| Established | June 02, 1997 |
| Disbanded | Still Active |
| Last Modified | Ralphie December 10, 2024 03:45pm |
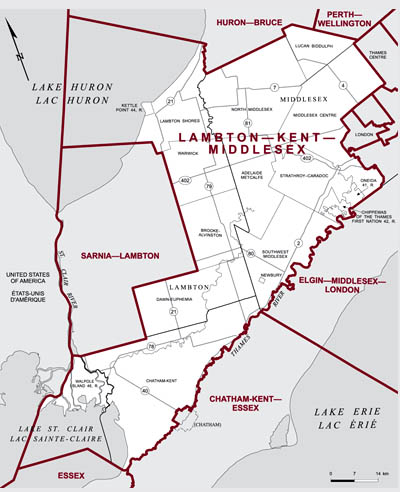
| Description | This rural riding in southwestern Ontario runs from Lake Huron in the northwest to the Thames River in the southeast and Lake St. Clair in the southwest.
It contains the city of Lambton Shores, the townships of Brooke-Alvinston, Dawn-Euphemia and Warwick and part of Middlesex county. A portion of the city of Chatham-Kent lying northwest of the Thames River falls within the riding. It contains several native reserves including the Chippewas of the Thames, Kettle Point No. 44, Walpole Island No. 46 and Oneida No. 41.
The major source of employment is manufacturing, which provides 13 per cent of jobs, followed by agriculture. The average family income is $66,332 and unemployment is 5.8 per cent.
The riding of Middlesex-Kent-Lambton was created in 2004 from 84 per cent of Lambton-Kent-Middlesex, 21 per cent of Perth-Middlesex and a small part of Elgin-Middlesex-London. The riding now extends further east to the London city limits than the former Lambton-Kent-Middlesex riding did.
Population: 105,291 |
|
Redistricting: Light Green=Added Territory, Red=Removed Territory, Dark Green=Kept Territory
| |
|
| |
| No Map In System
| |
|
[Download as CSV]
|