Home About Chat Users Issues Party Candidates Polling Firms Media News Polls Calendar Key Races United States President Senate House Governors International

New User Account
"A comprehensive, collaborative elections resource." 
Email: Password:

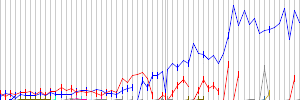
  MA - District 11 - History
House of Representatives DETAILS
Parents > United States > Massachusetts > MA - District 11   Raw Vote Total:

Percentages:

Website
Established January 03, 1873
Disbanded January 03, 1993
Last ModifiedRP December 20, 2002 08:15pm
Description

RACES [Show Primaries]
Redistricting: Light Green=Added Territory, Red=Removed Territory,
Dark Green=Kept Territory
Date Type Results
Nov 06, 1990 General Election
 Brian J. Donnelly(I)
145,480
99.66%
  Others (W)
492
0.34%
Nov 08, 1988 General Election
 Brian J. Donnelly(I)
169,692
80.82%
 Michael C. Gilleran
40,277
19.18%
Nov 04, 1986 General Election
 Brian J. Donnelly(I)
114,926
100.00%
  Others (W)
3
0.00%
Nov 06, 1984 General Election
 Brian J. Donnelly(I)
172,010
100.00%
Nov 02, 1982 General Election
 Brian J. Donnelly(I)
144,312
100.00%
Date Type Results
Nov 04, 1980 General Election
 Brian J. Donnelly(I)
137,066
100.00%
Nov 07, 1978 General Election
 Brian J. Donnelly
133,644
91.71%
 H. Graham Lowry
12,044
8.27%
  Others
34
0.02%
Nov 02, 1976 General Election
 James A. Burke(I)
131,789
68.98%
 Danielle deBenedictis
59,240
31.01%
  Write-In (W)
26
0.01%
Nov 05, 1974 General Election
 James A. Burke(I)
125,972
100.00%
Nov 07, 1972 General Election
 James A. Burke(I)
154,397
99.96%
  Others (W)
56
0.04%
Date Type Results
Nov 03, 1970 General Election
 James A. Burke(I)
143,026
99.98%
  Others (W)
23
0.02%
Nov 05, 1968 General Election
 James A. Burke(I)
169,766
100.00%
Date Type Results
Nov 08, 1966 General Election
 James A. Burke(I)
141,465
74.78%
 James L. Hofford
47,705
25.22%
Nov 03, 1964 General Election
 James A. Burke(I)
179,261
100.00%
Nov 06, 1962 General Election
 James A. Burke(I)
121,030
64.32%
 Harry F. Stimpson, Jr.
67,138
35.68%
Date Type Results
Nov 08, 1960 General Election
 Thomas P. "Tip" O'Neill, Jr.(I)
87,866
100.00%
Nov 04, 1958 General Election
 Thomas P. "Tip" O'Neill, Jr.(I)
68,353
80.39%
 Elliott H. Stone
16,669
19.61%
Nov 06, 1956 General Election
 Thomas P. "Tip" O'Neill, Jr.(I)
83,532
75.31%
 Rudolph E. Mottola
27,384
24.69%
Nov 02, 1954 General Election
 Thomas P. "Tip" O'Neill, Jr.(I)
75,613
78.23%
 Charles S. Bolster
21,039
21.77%
Nov 04, 1952 General Election
 Thomas P. "Tip" O'Neill, Jr.
86,532
69.29%
 Jesse A. Rogers
37,816
30.28%
 William D. Ross
542
0.43%
Nov 07, 1950 General Election
 John F. Kennedy(I)
87,699
82.28%
 Vincent J. Celeste
18,302
17.17%
 Martha E. Greer
582
0.55%
Nov 02, 1948 General Election
 John F. Kennedy(I)
106,366
100.00%
  Others (W)
2
0.00%
Nov 05, 1946 General Election
 John F. Kennedy
69,093
71.87%
 Lester W. Bowen
26,007
27.05%
 Philip Geer
1,036
1.08%
Nov 07, 1944 General Election
 James M. Curley(I)
75,469
65.63%
 Lester W. Bowen
39,523
34.37%
Nov 03, 1942 General Election
 James M. Curley
60,850
69.26%
 Vincent Mottola
27,008
30.74%
Date Type Results
Nov 05, 1940 General Election
 Thomas A. Flaherty(I)
68,041
83.77%
 Benjamin J. Green
13,176
16.22%
  Others (W)
3
0.00%
Nov 08, 1938 General Election
 Thomas A. Flaherty(I)
56,939
99.98%
  Others (W)
11
0.02%
Dec 14, 1937 Special Election
 Thomas A. Flaherty
14,441
69.64%
 John F. Cotter
6,297
30.36%
Nov 03, 1936 General Election
 John P. Higgins(I)
53,129
81.33%
 Joseph M. De Napoli
8,523
13.05%
 John R. Hughes
2,946
4.51%
 Aniello D. Imperato
719
1.10%
  Others (W)
9
0.01%
Nov 06, 1934 General Election
 John P. Higgins
46,383
99.95%
  Others (W)
24
0.05%
Nov 08, 1932 General Election
 John J. Douglass(I)
45,343
85.67%
 William F. McDonald
7,583
14.33%
Date Type Results
Nov 04, 1930 General Election
 George H. Tinkham(I)
40,417
63.00%
 John J. Kelleher
23,739
37.00%
Nov 06, 1928 General Election
 George H. Tinkham(I)
52,576
58.36%
 Maurice J. Tobin
37,514
41.64%
  Others (W)
4
0.00%
Nov 02, 1926 General Election
 George H. Tinkham(I)
48,948
100.00%
Date Type Results
Nov 04, 1924 General Election
 George H. Tinkham(I)
46,865
66.02%
 Timothy J. Driscoll
24,111
33.97%
  Others
9
0.01%
Nov 07, 1922 General Election
 George H. Tinkham(I)
33,396
60.29%
 David J. Brickley
21,999
39.71%
Nov 02, 1920 General Election
 George H. Tinkham(I)
40,278
68.46%
 Alfred J. Moore
18,553
31.54%
 Unidentified Scattering (W)
1
0.00%
Nov 05, 1918 General Election
 George H. Tinkham(I)
13,644
56.43%
 Francis J. Horgan
10,529
43.55%
  Others
4
0.02%
Nov 07, 1916 General Election
 George H. Tinkham(I)
18,424
60.08%
 Francis J. Hogan
12,244
39.92%
Date Type Results
Nov 03, 1914 General Election
 George H. Tinkham
13,510
49.78%
 Francis J. Horgan
11,863
43.71%
 Henry Clay Peters
1,765
6.50%
  Others
1
0.00%
Nov 05, 1912 General Election
 Andrew J. Peters(I)
17,875
64.03%
 Sherwin L. Cook
8,786
31.47%
 Charles F. Claus
1,253
4.49%
  Others (W)
2
0.01%
Date Type Results
Nov 08, 1910 General Election
 Andrew J. Peters(I)
18,933
59.22%
 William Dudley Cotton Jr.
13,033
40.77%
  Others
2
0.01%
Nov 03, 1908 General Election
 Andrew J. Peters(I)
15,881
48.73%
 Daniel W. Lane
15,447
47.40%
 Edwin M. White
1,260
3.87%
Nov 06, 1906 General Election
 Andrew J. Peters
18,099
53.94%
 Daniel W. Lane
14,670
43.72%
 George G. Cutting
785
2.34%
Nov 08, 1904 General Election
 John A. Sullivan(I)
18,045
51.57%
 Eugene Foss
15,990
45.69%
 George G. Cutting
852
2.43%
 Marion W. Addison
103
0.29%
  Others
4
0.01%
Nov 04, 1902 General Election
 John A. Sullivan
16,333
49.44%
 Eugene Foss
14,467
43.80%
 George G. Cutting
2,230
6.75%
  Others
3
0.01%
Date Type Results
Nov 06, 1900 General Election
 Samuel L. Powers
21,761
60.04%
 William H. Baker
10,885
30.03%
 Moorfield Storey
2,858
7.89%
 John A. McIsaac
737
2.03%
  Others
4
0.01%
Nov 08, 1898 General Election
 Charles F. Sprague(I)
17,001
61.32%
 William H. Baker
10,709
38.63%
  Others
13
0.05%
Nov 03, 1896 General Election
 Charles F. Sprague
22,993
69.37%
 William H. Baker
10,154
30.63%
Date Type Results
Nov 06, 1894 General Election
 William F. Draper(I)
16,905
61.98%
 Bentley W. Warren
9,456
34.67%
 John F. Dowd
916
3.36%
Nov 08, 1892 General Election
 William F. Draper
16,961
53.13%
 George Fred Williams(I)
14,404
45.12%
 Joseph D. Hunt
560
1.75%
Date Type Results
Nov 04, 1890 General Election
 Frederick S. Coolidge
9,300
40.00%
 Timothy G. Spaulding
9,150
39.36%
 Myron P. Walker
3,538
15.22%
 Henry C. Smith
1,260
5.42%
Nov 06, 1888 General Election
 Rodney Wallace
16,335
56.36%
 William Skinner
11,519
39.75%
 Hervey S. Cowell
1,128
3.89%
Nov 02, 1886 General Election
 William Whiting(I)
10,861
53.56%
 Festus C. Currier
8,098
39.93%
 Gardner A. Watkins
1,320
6.51%
Nov 04, 1884 General Election
 William Whiting(I)
15,325
60.01%
 David Hill
8,693
34.04%
 James Oliver
819
3.21%
 Wilbur F. Whitney
701
2.74%
Nov 07, 1882 General Election
 William Whiting
14,485
64.22%
 Edward J. Sawyer
7,602
33.70%
 Warren Johnson
302
1.34%
 Oscar Edwards
168
0.74%
Date Type Results
Nov 02, 1880 General Election
 George D. Robinson(I)
14,235
58.33%
 Albert C. Woodworth
10,007
41.00%
 E. W. Dickenson
100
0.41%
 Charles A. Merrill
64
0.26%
Nov 05, 1878 General Election
 George D. Robinson(I)
10,927
51.75%
 Edward H. Lathrop
7,994
37.86%
 Jarvis N. Dunham
2,069
9.80%
 Albert C. Woodworth
126
0.60%
Nov 07, 1876 General Election
 George D. Robinson
11,922
54.01%
 Chester W. Chapin(I)
9,760
44.22%
 F. L. McLean
211
0.96%
 H. M. Sessions
180
0.82%
Date Type Results
Nov 03, 1874 General Election
 Chester W. Chapin
11,964
65.77%
 Henry Alexander
6,227
34.23%
Nov 05, 1872 General Election
 Henry Laurens Dawes(I)
12,260
63.90%
 John F. Arnold
6,927
36.10%

DISCUSSION
[Download as CSV]